|
|
|||||||||||||||||
| Point ID: 6643 | Downloads | Plots | Site Data | Code: 9500 |
|
|
|||||||||||||||||
| Download | |
|---|---|
| Site Descriptor Information | Site Time Series Data |
| Link to all available data | |
|
|
| View: | Statistics | Time Series |
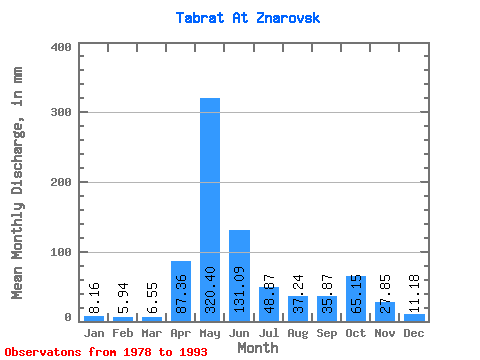
| Units: | m3/s |
| Statistic | Jan | Feb | Mar | Apr | May | Jun | Jul | Aug | Sep | Oct | Nov | Dec | Annual |
|---|---|---|---|---|---|---|---|---|---|---|---|---|---|
| Mean | 8.15 | 5.99 | 6.55 | 87.36 | 320.36 | 131.09 | 48.86 | 37.23 | 35.87 | 65.14 | 27.85 | 11.18 | 781.54 |
| Standard Deviation | 1.83 | 1.37 | 1.82 | 51.16 | 85.06 | 53.97 | 25.28 | 25.24 | 20.56 | 47.26 | 13.36 | 4.08 | 148.68 |
| Min | 5.22 | 4.29 | 4.12 | 18.94 | 190.13 | 39.27 | 24.28 | 16.30 | 11.62 | 16.72 | 11.30 | 6.88 | 548.05 |
| Max | 11.25 | 8.97 | 10.06 | 207.03 | 458.36 | 226.34 | 110.34 | 105.25 | 77.64 | 178.25 | 50.53 | 20.67 | 987.44 |
| Coefficient of Variation | 0.22 | 0.23 | 0.28 | 0.59 | 0.27 | 0.41 | 0.52 | 0.68 | 0.57 | 0.73 | 0.48 | 0.36 | 0.19 |
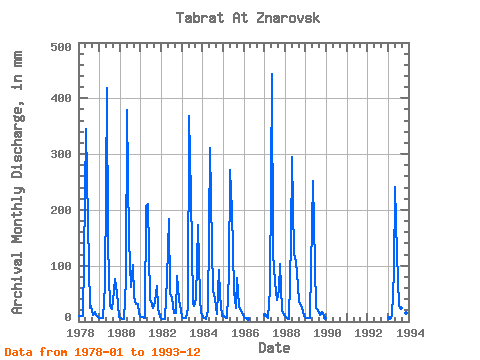
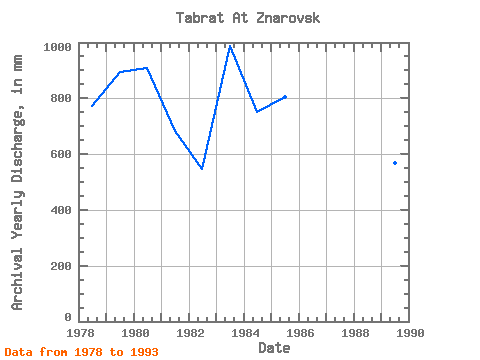
| Year | Jan | Feb | Mar | Apr | May | Jun | Jul | Aug | Sep | Oct | Nov | Dec | Annual | 1978 | 10.57 | 8.97 | 10.06 | 111.32 | 356.50 | 177.46 | 24.28 | 28.10 | 11.79 | 18.50 | 11.30 | 7.68 | 773.62 | 1979 | 6.71 | 5.84 | 7.38 | 63.26 | 432.89 | 139.25 | 29.24 | 23.43 | 54.63 | 78.52 | 50.53 | 8.53 | 894.66 | 1980 | 5.90 | 4.56 | 4.12 | 74.76 | 390.88 | 145.41 | 64.08 | 105.25 | 44.36 | 32.17 | 31.01 | 13.33 | 909.50 | 1981 | 9.21 | 6.92 | 7.13 | 207.03 | 218.15 | 39.27 | 38.37 | 25.76 | 34.79 | 65.78 | 24.56 | 8.15 | 683.47 | 1982 | 5.22 | 4.29 | 5.22 | 76.40 | 190.13 | 51.76 | 43.29 | 16.30 | 15.77 | 83.61 | 38.90 | 20.67 | 548.05 | 1983 | 9.08 | 6.11 | 7.17 | 23.33 | 380.69 | 226.34 | 35.14 | 29.11 | 40.22 | 178.25 | 41.90 | 16.51 | 987.44 | 1984 | 7.43 | 5.30 | 5.47 | 18.94 | 321.70 | 132.68 | 58.99 | 41.17 | 14.21 | 95.49 | 46.01 | 10.40 | 751.61 | 1985 | 10.10 | 6.84 | 5.86 | 85.85 | 280.96 | 197.99 | 56.45 | 25.51 | 77.64 | 27.97 | 18.98 | 12.35 | 805.09 | 1986 | 7.51 | 5.30 | 5.35 | 1987 | 11.25 | 8.00 | 6.88 | 57.92 | 458.36 | 123.23 | 72.57 | 39.38 | 56.28 | 107.38 | 20.42 | 11.59 | 964.97 | 1988 | 8.70 | 5.53 | 4.58 | 145.00 | 305.15 | 120.36 | 110.34 | 67.06 | 34.79 | 29.71 | 19.14 | 9.89 | 855.77 | 1989 | 7.30 | 5.57 | 6.03 | 95.30 | 260.16 | 98.59 | 25.80 | 20.50 | 11.62 | 16.72 | 15.49 | 6.88 | 567.47 | 1993 | 7.04 | 4.68 | 9.89 | 89.14 | 248.70 | 120.77 | 27.80 | 25.25 | 34.38 | 47.53 | 15.94 | 8.19 | 636.78 |
|---|
 Return to R-Arctic Net Home Page