|
|
|||||||||||||||||
| Point ID: 590 | Downloads | Plots | Site Data | Code: 07AB002 |
|
|
|||||||||||||||||
| Download | |
|---|---|
| Site Descriptor Information | Site Time Series Data |
| Link to all available data | |
|
|
| View: | Statistics | Time Series |
| Units: | m3/s |
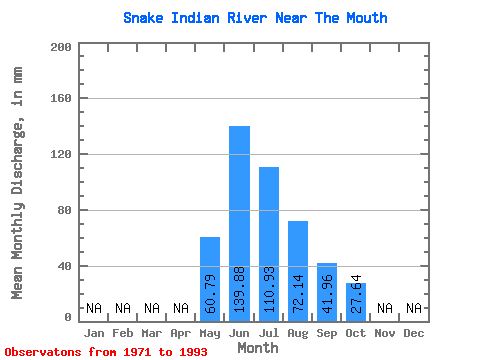
| Statistic | Jan | Feb | Mar | Apr | May | Jun | Jul | Aug | Sep | Oct | Nov | Dec | Annual |
|---|---|---|---|---|---|---|---|---|---|---|---|---|---|
| Mean | 60.78 | 139.88 | 110.92 | 72.13 | 41.96 | 27.64 | |||||||
| Standard Deviation | 18.65 | 59.21 | 30.88 | 19.68 | 10.74 | 7.17 | |||||||
| Min | 23.56 | 69.72 | 57.12 | 47.29 | 28.71 | 18.48 | |||||||
| Max | 87.80 | 344.51 | 174.58 | 124.75 | 70.21 | 40.17 | |||||||
| Coefficient of Variation | 0.31 | 0.42 | 0.28 | 0.27 | 0.26 | 0.26 |
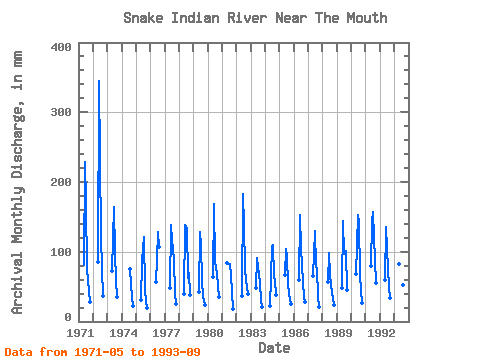
| Year | Jan | Feb | Mar | Apr | May | Jun | Jul | Aug | Sep | Oct | Nov | Dec | Annual | 1971 | 83.73 | 228.03 | 174.58 | 78.48 | 43.64 | 29.49 | 1972 | 87.80 | 344.51 | 126.44 | 76.44 | 36.09 | 1973 | 74.75 | 163.56 | 101.53 | 60.68 | 35.27 | 1974 | 77.12 | 34.12 | 22.37 | 1975 | 31.70 | 86.45 | 124.58 | 47.29 | 28.71 | 19.66 | 1976 | 57.80 | 88.42 | 131.87 | 111.02 | 1977 | 49.83 | 137.97 | 120.17 | 91.53 | 40.69 | 26.44 | 1978 | 40.68 | 138.46 | 138.14 | 64.92 | 70.21 | 38.65 | 1979 | 43.22 | 128.12 | 112.88 | 61.36 | 34.78 | 23.90 | 1980 | 65.42 | 168.97 | 87.97 | 70.00 | 50.20 | 35.93 | 1981 | 87.12 | 82.85 | 84.58 | 68.81 | 41.83 | 18.48 | 1982 | 37.29 | 182.10 | 143.22 | 77.97 | 60.04 | 40.17 | 1983 | 50.17 | 91.54 | 80.51 | 56.95 | 30.35 | 20.85 | 1984 | 23.56 | 106.47 | 113.73 | 67.46 | 57.75 | 39.15 | 1985 | 68.14 | 103.52 | 95.25 | 55.26 | 40.03 | 25.59 | 1986 | 61.36 | 152.90 | 109.32 | 58.98 | 34.29 | 28.30 | 1987 | 67.12 | 129.27 | 80.51 | 77.12 | 36.91 | 21.36 | 1988 | 58.31 | 98.92 | 70.00 | 54.07 | 32.15 | 25.09 | 1989 | 49.49 | 144.04 | 100.34 | 103.90 | 45.11 | 1990 | 71.02 | 152.90 | 147.80 | 68.81 | 44.46 | 26.78 | 1991 | 82.54 | 143.87 | 162.38 | 124.75 | 55.45 | 1992 | 61.02 | 134.85 | 77.29 | 51.53 | 33.63 | 1993 | 85.09 | 69.72 | 57.12 | 54.58 | 37.40 |
|---|
 Return to R-Arctic Net Home Page