|
|
|||||||||||||||||
| Point ID: 318 | Downloads | Plots | Site Data | Code: 05BL021 |
|
|
|||||||||||||||||
| Download | |
|---|---|
| Site Descriptor Information | Site Time Series Data |
| Link to all available data | |
|
|
| View: | Statistics | Time Series |
| Units: | m3/s |
| Statistic | Jan | Feb | Mar | Apr | May | Jun | Jul | Aug | Sep | Oct | Nov | Dec | Annual |
|---|---|---|---|---|---|---|---|---|---|---|---|---|---|
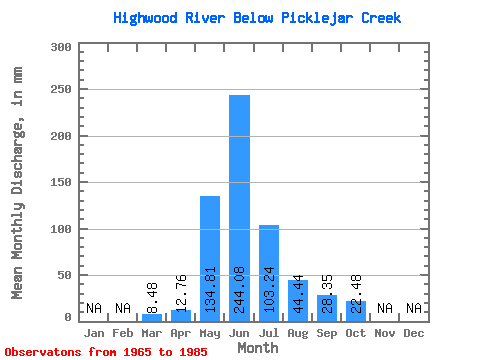
| Mean | 8.48 | 12.76 | 134.80 | 244.08 | 103.22 | 44.44 | 28.36 | 22.48 | |||||
| Standard Deviation | 6.62 | 53.38 | 93.88 | 41.35 | 15.10 | 10.54 | 8.79 | ||||||
| Min | 8.48 | 8.13 | 50.72 | 93.08 | 33.27 | 23.13 | 15.59 | 12.78 | |||||
| Max | 8.48 | 22.58 | 233.31 | 437.89 | 175.29 | 84.80 | 58.91 | 51.12 | |||||
| Coefficient of Variation | 0.52 | 0.40 | 0.39 | 0.40 | 0.34 | 0.37 | 0.39 |
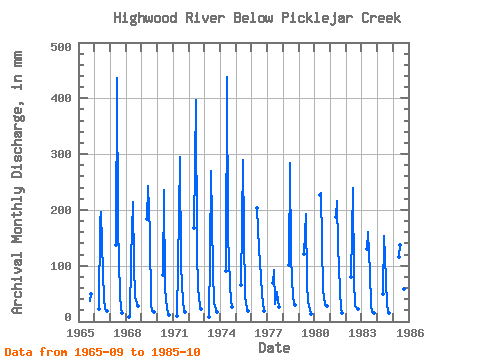
| Year | Jan | Feb | Mar | Apr | May | Jun | Jul | Aug | Sep | Oct | Nov | Dec | Annual | 1965 | 36.13 | 51.12 | 1966 | 22.58 | 184.62 | 196.36 | 90.08 | 41.39 | 21.60 | 18.95 | 1967 | 141.20 | 435.93 | 175.29 | 48.28 | 23.76 | 15.70 | 1968 | 8.48 | 9.88 | 115.64 | 214.04 | 104.28 | 45.45 | 32.40 | 28.20 | 1969 | 189.69 | 243.49 | 161.49 | 30.84 | 19.64 | 16.88 | 1970 | 86.22 | 235.64 | 60.86 | 23.13 | 15.59 | 12.78 | 1971 | 10.47 | 198.62 | 294.55 | 103.27 | 36.72 | 20.82 | 17.73 | 1972 | 173.26 | 396.65 | 129.64 | 61.47 | 28.47 | 23.53 | 1973 | 8.13 | 119.09 | 269.02 | 95.35 | 33.68 | 27.49 | 16.96 | 1974 | 93.53 | 437.89 | 160.27 | 69.18 | 36.33 | 26.37 | 1975 | 68.37 | 288.65 | 164.74 | 45.24 | 23.37 | 18.73 | 1976 | 210.99 | 163.77 | 107.32 | 84.80 | 46.93 | 19.76 | 1977 | 71.01 | 93.08 | 33.27 | 54.37 | 35.94 | 25.97 | 1978 | 104.69 | 284.73 | 118.68 | 43.62 | 34.76 | 31.24 | 1979 | 124.36 | 192.24 | 68.98 | 37.13 | 20.42 | 14.06 | 1980 | 233.31 | 229.75 | 55.79 | 45.65 | 29.06 | 28.40 | 1981 | 193.34 | 216.00 | 139.78 | 57.41 | 22.78 | 16.19 | 1982 | 83.18 | 239.56 | 76.28 | 28.61 | 24.74 | 23.74 | 1983 | 133.90 | 159.84 | 90.28 | 31.24 | 17.38 | 16.23 | 1984 | 50.72 | 153.56 | 76.69 | 30.64 | 19.07 | 16.59 | 1985 | 120.31 | 136.87 | 51.94 | 39.97 | 58.91 | 32.87 |
|---|
 Return to R-Arctic Net Home Page