|
|
|||||||||||||||||
| Point ID: 8535 | Downloads | Plots | Site Data | Code: 10693 |
|
|
|||||||||||||||||
| Download | |
|---|---|
| Site Descriptor Information | Site Time Series Data |
| Link to all available data | |
|
|
| View: | Statistics | Time Series |
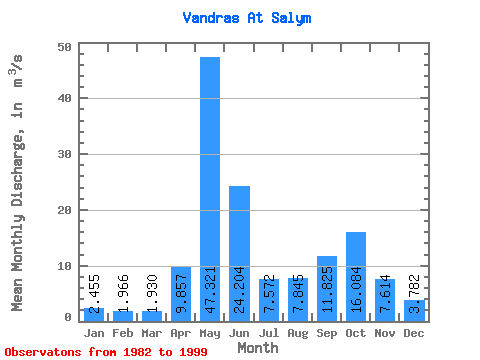
| Units: | mm |
| Statistic | Jan | Feb | Mar | Apr | May | Jun | Jul | Aug | Sep | Oct | Nov | Dec | Annual |
|---|---|---|---|---|---|---|---|---|---|---|---|---|---|
| Mean | 2.46 | 1.97 | 1.93 | 9.86 | 47.32 | 24.20 | 7.57 | 7.84 | 11.82 | 16.08 | 7.61 | 3.78 | 11.80 |
| Standard Deviation | 0.97 | 0.76 | 0.75 | 12.77 | 17.16 | 20.07 | 4.62 | 5.54 | 7.76 | 12.49 | 4.34 | 1.91 | 3.74 |
| Min | 0.84 | 0.64 | 0.47 | 1.33 | 21.30 | 4.47 | 2.00 | 1.57 | 1.87 | 1.78 | 1.42 | 1.28 | 5.84 |
| Max | 4.19 | 3.37 | 3.33 | 43.80 | 87.40 | 79.80 | 17.30 | 24.30 | 27.20 | 43.00 | 15.40 | 7.19 | 17.57 |
| Coefficient of Variation | 0.40 | 0.39 | 0.39 | 1.29 | 0.36 | 0.83 | 0.61 | 0.71 | 0.66 | 0.78 | 0.57 | 0.50 | 0.32 |
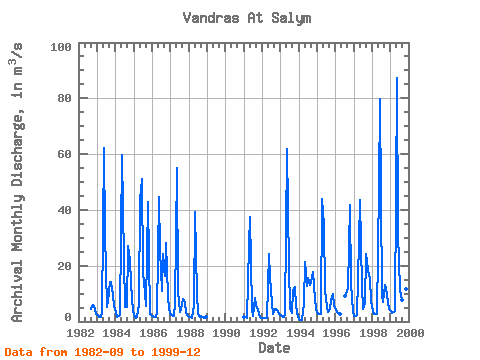
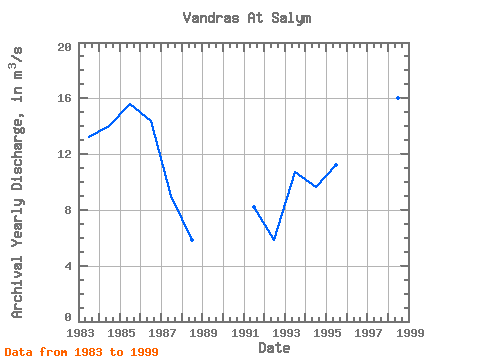
| Year | Jan | Feb | Mar | Apr | May | Jun | Jul | Aug | Sep | Oct | Nov | Dec | Annual | 1982 | 4.41 | 5.88 | 5.52 | 2.55 | 1983 | 2.25 | 1.64 | 1.61 | 3.57 | 62.20 | 31.80 | 5.08 | 7.43 | 14.00 | 14.10 | 9.36 | 5.55 | 13.22 | 1984 | 3.50 | 1.76 | 2.04 | 2.43 | 59.80 | 22.20 | 5.31 | 5.14 | 27.20 | 21.90 | 13.40 | 3.61 | 14.02 | 1985 | 2.36 | 1.41 | 1.58 | 6.35 | 43.50 | 51.00 | 17.30 | 10.10 | 5.44 | 43.00 | 2.84 | 2.41 | 15.61 | 1986 | 1.92 | 1.71 | 1.75 | 3.52 | 44.50 | 25.40 | 11.10 | 24.30 | 16.20 | 28.00 | 9.22 | 4.53 | 14.35 | 1987 | 2.32 | 2.16 | 1.84 | 6.26 | 54.90 | 10.50 | 3.51 | 6.01 | 8.24 | 6.83 | 3.22 | 1.87 | 8.97 | 1988 | 1.63 | 1.49 | 1.39 | 5.66 | 39.30 | 9.69 | 2.82 | 1.57 | 1.87 | 1.78 | 1.42 | 1.49 | 5.84 | 1991 | 1.78 | 1.46 | 1.35 | 27.50 | 37.40 | 4.47 | 2.00 | 8.50 | 5.58 | 4.40 | 2.37 | 1.28 | 8.17 | 1992 | 1.35 | 1.29 | 1.22 | 1.33 | 24.10 | 16.10 | 6.80 | 2.77 | 4.55 | 4.36 | 3.86 | 2.76 | 5.87 | 1993 | 2.42 | 2.06 | 1.66 | 2.72 | 61.80 | 19.60 | 4.68 | 3.19 | 10.80 | 12.40 | 5.69 | 1.77 | 10.73 | 1994 | 0.84 | 0.64 | 0.47 | 6.72 | 21.30 | 12.70 | 15.70 | 13.20 | 14.00 | 17.70 | 8.11 | 4.52 | 9.66 | 1995 | 2.85 | 2.69 | 2.72 | 43.80 | 34.60 | 11.40 | 5.17 | 3.47 | 4.41 | 7.59 | 9.68 | 6.08 | 11.21 | 1996 | 4.19 | 3.37 | 2.81 | 2.51 | 9.18 | 10.40 | 12.10 | 41.70 | 13.30 | 3.74 | 1997 | 1.91 | 1.80 | 2.42 | 29.00 | 43.60 | 12.50 | 4.45 | 6.71 | 24.30 | 18.40 | 15.40 | 7.19 | 13.97 | 1998 | 3.82 | 2.79 | 2.76 | 2.78 | 48.10 | 79.80 | 9.18 | 7.09 | 13.10 | 12.10 | 6.83 | 4.31 | 16.05 | 1999 | 3.69 | 3.22 | 3.33 | 3.71 | 87.40 | 31.70 | 11.30 | 7.80 | 23.00 | 17.20 | 11.60 | 6.85 | 17.57 |
|---|
 Return to R-Arctic Net Home Page