|
|
|||||||||||||||||
| Point ID: 8802 | Downloads | Plots | Site Data | Code: 12270 |
|
|
|||||||||||||||||
| Download | |
|---|---|
| Site Descriptor Information | Site Time Series Data |
| Link to all available data | |
|
|
| View: | Statistics | Time Series |
| Units: | m3/s |
| Statistic | Jan | Feb | Mar | Apr | May | Jun | Jul | Aug | Sep | Oct | Nov | Dec | Annual |
|---|---|---|---|---|---|---|---|---|---|---|---|---|---|
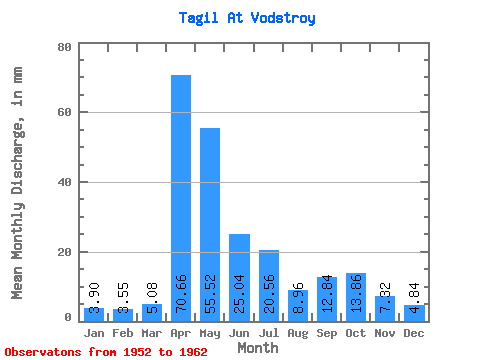
| Mean | 3.90 | 3.58 | 5.08 | 70.66 | 55.51 | 25.05 | 20.55 | 8.96 | 12.85 | 13.85 | 7.32 | 4.84 | 230.28 |
| Standard Deviation | 0.80 | 0.72 | 2.56 | 35.52 | 32.69 | 20.61 | 19.86 | 6.03 | 9.15 | 5.35 | 3.92 | 1.52 | 73.93 |
| Min | 2.96 | 2.85 | 2.61 | 13.13 | 22.26 | 6.23 | 4.17 | 3.13 | 4.38 | 4.87 | 3.20 | 2.96 | 153.02 |
| Max | 4.70 | 4.44 | 8.70 | 101.83 | 103.12 | 59.25 | 55.47 | 20.00 | 28.61 | 18.78 | 13.30 | 6.61 | 326.87 |
| Coefficient of Variation | 0.21 | 0.20 | 0.50 | 0.50 | 0.59 | 0.82 | 0.97 | 0.67 | 0.71 | 0.39 | 0.54 | 0.31 | 0.32 |
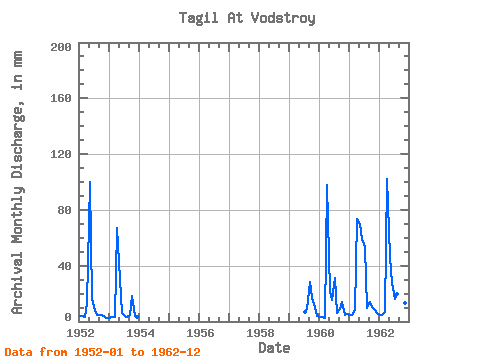
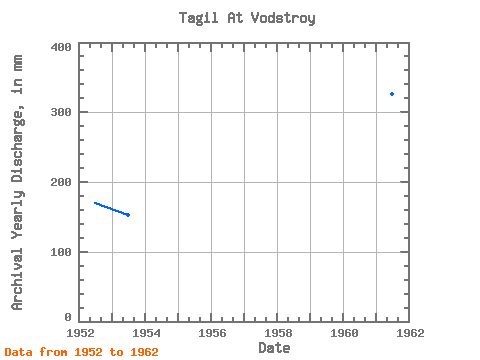
| Year | Jan | Feb | Mar | Apr | May | Jun | Jul | Aug | Sep | Oct | Nov | Dec | Annual | 1952 | 4.17 | 3.64 | 3.65 | 13.13 | 103.12 | 16.16 | 8.35 | 4.70 | 4.38 | 4.87 | 3.20 | 2.96 | 170.78 | 1953 | 2.96 | 2.85 | 3.65 | 66.99 | 31.82 | 6.23 | 4.17 | 3.13 | 4.54 | 18.78 | 4.21 | 3.48 | 153.02 | 1959 | 6.80 | 9.56 | 28.61 | 17.74 | 10.10 | 4.17 | 1960 | 3.13 | 2.85 | 2.61 | 97.96 | 22.26 | 15.65 | 32.00 | 6.43 | 9.09 | 14.09 | 4.88 | 5.56 | 217.06 | 1961 | 4.70 | 4.44 | 8.70 | 73.38 | 72.34 | 59.25 | 55.47 | 9.91 | 13.80 | 10.43 | 8.25 | 6.61 | 326.87 | 1962 | 4.52 | 4.12 | 6.78 | 101.83 | 47.99 | 27.94 | 16.52 | 20.00 | 16.66 | 17.22 | 13.30 | 6.26 | 283.66 |
|---|
 Return to R-Arctic Net Home Page