|
|
|||||||||||||||||
| Point ID: 8694 | Downloads | Plots | Site Data | Code: 11614 |
|
|
|||||||||||||||||
| Download | |
|---|---|
| Site Descriptor Information | Site Time Series Data |
| Link to all available data | |
|
|
| View: | Statistics | Time Series |
| Units: | m3/s |
| Statistic | Jan | Feb | Mar | Apr | May | Jun | Jul | Aug | Sep | Oct | Nov | Dec | Annual |
|---|---|---|---|---|---|---|---|---|---|---|---|---|---|
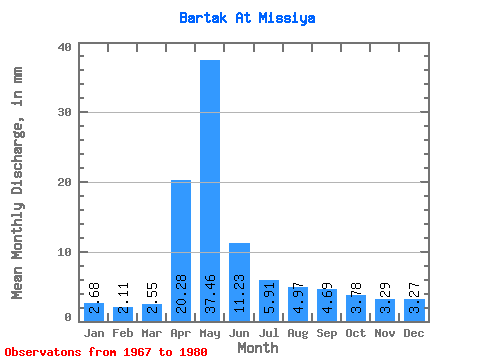
| Mean | 2.66 | 2.11 | 2.57 | 20.30 | 37.44 | 11.22 | 5.91 | 4.96 | 4.68 | 3.78 | 3.29 | 3.28 | 118.86 |
| Standard Deviation | 0.61 | 0.81 | 0.92 | 13.45 | 37.95 | 8.10 | 2.39 | 2.47 | 1.85 | 2.57 | 2.42 | 1.41 | 58.17 |
| Min | 1.70 | 0.78 | 1.06 | 5.76 | 7.65 | 3.54 | 3.40 | 2.55 | 3.29 | 0.00 | 0.00 | 1.70 | 60.53 |
| Max | 3.40 | 3.49 | 4.25 | 47.31 | 119.47 | 27.57 | 11.05 | 12.35 | 9.46 | 8.93 | 7.82 | 5.95 | 211.38 |
| Coefficient of Variation | 0.23 | 0.38 | 0.36 | 0.66 | 1.01 | 0.72 | 0.40 | 0.50 | 0.40 | 0.68 | 0.74 | 0.43 | 0.49 |
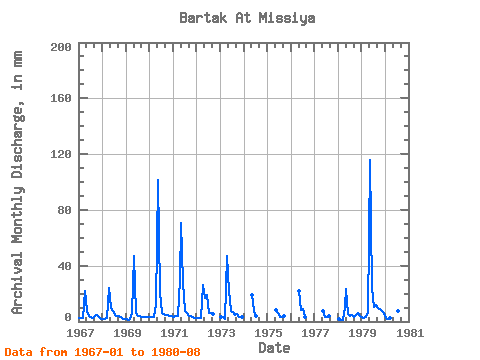
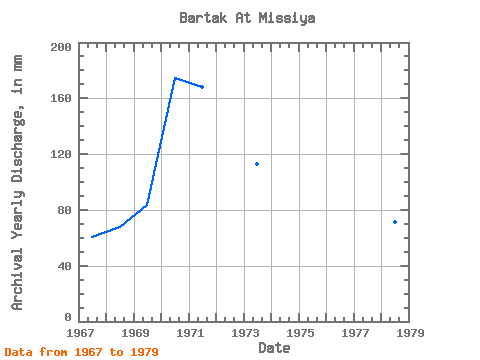
| Year | Jan | Feb | Mar | Apr | May | Jun | Jul | Aug | Sep | Oct | Nov | Dec | Annual | 1967 | 2.55 | 2.32 | 2.55 | 21.81 | 7.65 | 4.11 | 3.40 | 2.55 | 3.70 | 4.68 | 3.29 | 1.70 | 60.53 | 1968 | 2.12 | 1.55 | 2.55 | 23.86 | 9.78 | 7.82 | 5.10 | 3.83 | 3.70 | 3.40 | 2.06 | 1.70 | 67.63 | 1969 | 1.70 | 0.78 | 1.70 | 5.76 | 48.88 | 5.76 | 3.83 | 3.83 | 3.29 | 2.98 | 2.88 | 2.98 | 83.49 | 1970 | 2.98 | 2.71 | 3.40 | 11.93 | 104.57 | 21.39 | 5.95 | 5.53 | 4.94 | 5.10 | 4.11 | 3.83 | 174.92 | 1971 | 3.40 | 3.49 | 4.25 | 29.62 | 72.69 | 27.57 | 8.08 | 5.95 | 3.70 | 4.25 | 3.29 | 2.55 | 168.24 | 1972 | 2.55 | 2.32 | 2.55 | 25.92 | 17.43 | 19.34 | 5.95 | 5.95 | 5.35 | 1973 | 3.40 | 2.71 | 1.70 | 47.31 | 22.95 | 7.41 | 6.80 | 4.68 | 5.35 | 3.83 | 3.29 | 3.40 | 113.13 | 1974 | 19.98 | 7.82 | 4.25 | 0.00 | 0.00 | 1975 | 8.50 | 5.76 | 3.61 | 2.98 | 3.70 | 0.00 | 0.00 | 1976 | 22.95 | 8.23 | 8.93 | 3.19 | 1977 | 7.65 | 3.54 | 3.44 | 4.25 | 1978 | 2.04 | 1.08 | 1.06 | 10.70 | 24.23 | 5.35 | 4.21 | 4.68 | 3.58 | 4.68 | 6.17 | 4.17 | 71.59 | 1979 | 3.40 | 2.21 | 3.15 | 5.79 | 119.47 | 23.89 | 11.05 | 12.35 | 9.46 | 8.93 | 7.82 | 5.95 | 211.38 | 1980 | 2.46 | 1.94 | 2.81 | 9.05 | 8.08 | 4.68 |
|---|
 Return to R-Arctic Net Home Page