|
|
|||||||||||||||||
| Point ID: 6327 | Downloads | Plots | Site Data | Code: 3577 |
|
|
|||||||||||||||||
| Download | |
|---|---|
| Site Descriptor Information | Site Time Series Data |
| Link to all available data | |
|
|
| View: | Statistics | Time Series |
| Units: | m3/s |
| Statistic | Jan | Feb | Mar | Apr | May | Jun | Jul | Aug | Sep | Oct | Nov | Dec | Annual |
|---|---|---|---|---|---|---|---|---|---|---|---|---|---|
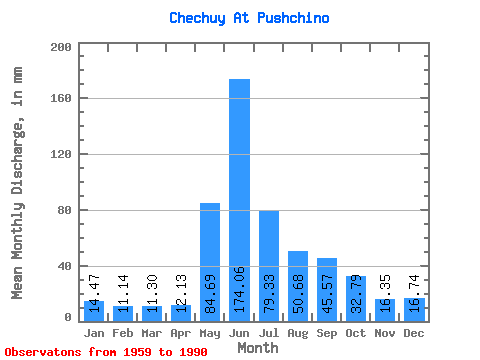
| Mean | 14.47 | 11.23 | 11.30 | 12.13 | 84.68 | 174.06 | 79.32 | 50.67 | 45.57 | 32.78 | 16.35 | 16.74 | 574.73 |
| Standard Deviation | 2.40 | 1.65 | 1.26 | 3.73 | 38.82 | 79.70 | 27.47 | 13.34 | 14.96 | 8.19 | 2.42 | 2.01 | 91.93 |
| Min | 11.45 | 9.04 | 9.32 | 8.41 | 0.78 | 0.12 | 45.98 | 26.35 | 22.50 | 19.37 | 12.73 | 13.62 | 420.93 |
| Max | 18.78 | 13.50 | 12.94 | 21.22 | 134.11 | 264.14 | 130.71 | 73.23 | 69.64 | 45.98 | 19.33 | 18.86 | 704.25 |
| Coefficient of Variation | 0.17 | 0.15 | 0.11 | 0.31 | 0.46 | 0.46 | 0.35 | 0.26 | 0.33 | 0.25 | 0.15 | 0.12 | 0.16 |
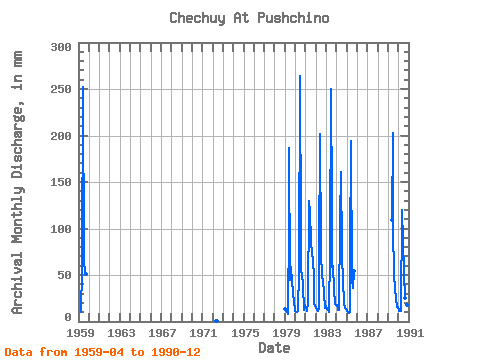
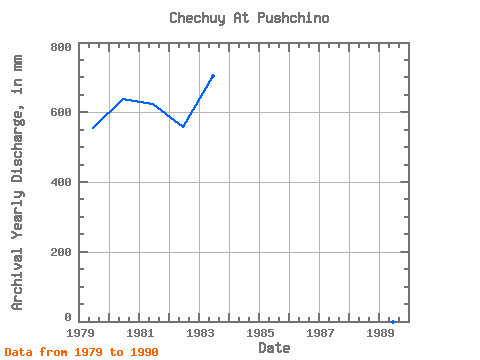
| Year | Jan | Feb | Mar | Apr | May | Jun | Jul | Aug | Sep | Oct | Nov | Dec | Annual | 1959 | 9.93 | 57.90 | 252.19 | 66.84 | 54.92 | 51.51 | 1972 | 0.78 | 0.12 | 1979 | 14.13 | 10.71 | 10.60 | 8.41 | 108.99 | 186.67 | 45.98 | 60.03 | 42.03 | 33.63 | 17.51 | 16.26 | 554.35 | 1980 | 11.45 | 9.15 | 10.13 | 10.96 | 57.05 | 264.14 | 98.78 | 54.92 | 50.69 | 39.51 | 12.73 | 18.86 | 638.85 | 1981 | 14.94 | 12.14 | 11.37 | 21.22 | 134.11 | 117.03 | 90.69 | 73.23 | 69.64 | 45.98 | 19.33 | 18.31 | 625.30 | 1982 | 15.24 | 11.52 | 12.01 | 13.64 | 70.25 | 201.10 | 77.91 | 48.54 | 44.51 | 32.06 | 14.42 | 17.75 | 558.95 | 1983 | 16.18 | 13.07 | 12.77 | 10.38 | 77.91 | 250.13 | 130.71 | 60.46 | 59.75 | 35.55 | 19.12 | 18.52 | 704.25 | 1984 | 18.78 | 13.50 | 12.94 | 12.57 | 113.25 | 160.71 | 77.06 | 40.83 | 24.48 | 19.37 | 14.51 | 13.62 | 520.48 | 1985 | 11.75 | 9.04 | 9.32 | 10.59 | 74.51 | 193.68 | 46.41 | 37.21 | 54.81 | 1989 | 112.40 | 202.75 | 104.74 | 50.24 | 35.81 | 25.12 | 15.41 | 16.52 | 1990 | 13.28 | 10.74 | 11.24 | 11.50 | 124.32 | 86.12 | 54.07 | 26.35 | 22.50 | 31.04 | 17.76 | 14.05 | 420.93 |
|---|
 Return to R-Arctic Net Home Page