|
|
|||||||||||||||||
| Point ID: 5890 | Downloads | Plots | Site Data | Code: 1302 |
|
|
|||||||||||||||||
| Download | |
|---|---|
| Site Descriptor Information | Site Time Series Data |
| Link to all available data | |
|
|
| View: | Statistics | Time Series |
| Units: | m3/s |
| Statistic | Jan | Feb | Mar | Apr | May | Jun | Jul | Aug | Sep | Oct | Nov | Dec | Annual |
|---|---|---|---|---|---|---|---|---|---|---|---|---|---|
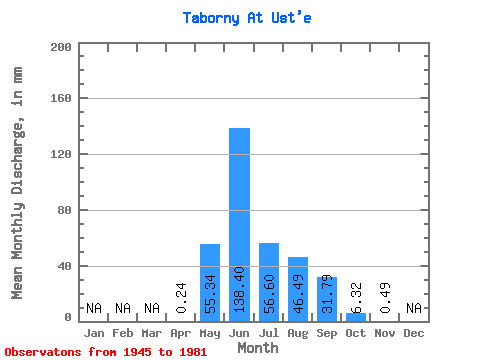
| Mean | 0.24 | 55.22 | 138.43 | 56.55 | 46.58 | 31.86 | 6.40 | 0.57 | |||||
| Standard Deviation | 0.00 | 41.68 | 77.21 | 38.48 | 33.81 | 21.82 | 4.42 | 0.49 | |||||
| Min | 0.24 | 1.01 | 41.57 | 16.42 | 12.63 | 7.58 | 0.76 | 0.24 | |||||
| Max | 0.24 | 186.96 | 330.11 | 224.85 | 171.80 | 112.48 | 20.97 | 1.71 | |||||
| Coefficient of Variation | 0.00 | 0.76 | 0.56 | 0.68 | 0.73 | 0.69 | 0.69 | 0.86 |
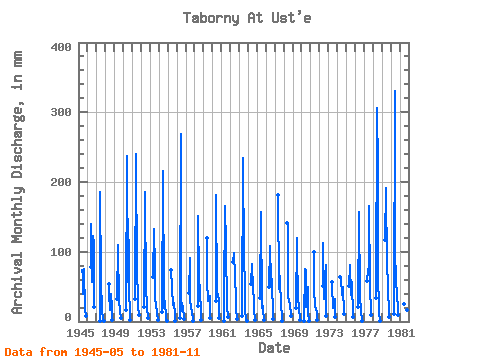
| Year | Jan | Feb | Mar | Apr | May | Jun | Jul | Aug | Sep | Oct | Nov | Dec | Annual | 1945 | 75.79 | 66.02 | 40.42 | 78.32 | 17.12 | 8.34 | 1946 | 80.84 | 139.38 | 58.11 | 126.32 | 112.48 | 20.97 | 1947 | 1.01 | 185.84 | 63.16 | 12.63 | 7.58 | 3.03 | 0.24 | 1948 | 55.58 | 41.57 | 16.42 | 40.42 | 21.03 | 2.02 | 1949 | 32.84 | 110.04 | 25.26 | 20.21 | 15.16 | 4.55 | 1950 | 16.93 | 237.19 | 58.11 | 121.27 | 53.80 | 2.27 | 1951 | 32.84 | 239.64 | 68.21 | 40.42 | 22.74 | 9.85 | 1952 | 21.22 | 185.84 | 40.42 | 50.53 | 20.54 | 5.81 | 1953 | 65.69 | 132.04 | 78.32 | 32.84 | 23.72 | 13.14 | 1.71 | 1954 | 13.64 | 215.19 | 35.37 | 20.46 | 29.34 | 5.56 | 0.49 | 1955 | 75.79 | 48.91 | 48.00 | 24.25 | 26.90 | 9.10 | 0.24 | 1956 | 4.55 | 268.98 | 40.42 | 16.17 | 21.52 | 3.03 | 1957 | 42.95 | 90.47 | 30.32 | 20.97 | 12.47 | 3.79 | 0.49 | 1958 | 22.48 | 151.61 | 65.69 | 42.95 | 16.14 | 2.78 | 1959 | 123.79 | 58.69 | 30.32 | 35.37 | 36.68 | 5.81 | 1960 | 30.32 | 180.95 | 42.95 | 40.42 | 29.34 | 4.80 | 1961 | 0.24 | 37.90 | 166.28 | 111.16 | 21.48 | 22.74 | 7.07 | 1962 | 88.42 | 97.81 | 65.69 | 35.37 | 18.58 | 4.29 | 1963 | 8.59 | 234.75 | 90.95 | 55.58 | 15.65 | 3.79 | 0.24 | 1964 | 55.58 | 83.14 | 48.00 | 63.16 | 16.14 | 2.53 | 1965 | 35.37 | 156.50 | 20.21 | 27.79 | 17.61 | 2.53 | 1966 | 50.53 | 107.59 | 60.63 | 53.05 | 61.13 | 4.04 | 1967 | 186.96 | 46.46 | 78.32 | 58.11 | 24.45 | 5.81 | 0.49 | 1968 | 146.53 | 136.94 | 37.90 | 30.32 | 24.45 | 7.58 | 1969 | 20.46 | 119.82 | 101.06 | 35.37 | 20.30 | 2.02 | 1970 | 0.24 | 78.32 | 73.36 | 21.98 | 23.50 | 48.91 | 12.63 | 0.24 | 1971 | 103.58 | 46.46 | 23.24 | 17.94 | 11.98 | 2.27 | 1972 | 53.05 | 112.48 | 32.84 | 35.37 | 80.69 | 8.84 | 1973 | 58.11 | 51.35 | 19.71 | 23.50 | 31.79 | 6.32 | 1974 | 65.69 | 61.13 | 40.42 | 35.37 | 48.91 | 11.37 | 1975 | 53.05 | 80.69 | 40.42 | 35.37 | 56.24 | 6.57 | 1976 | 20.97 | 156.50 | 35.37 | 16.42 | 14.43 | 0.76 | 1977 | 60.63 | 73.36 | 80.84 | 171.80 | 53.80 | 9.10 | 1978 | 35.37 | 305.66 | 224.85 | 75.79 | 12.23 | 1.26 | 1979 | 121.27 | 190.73 | 80.84 | 83.37 | 53.80 | 6.82 | 1980 | 11.37 | 330.11 | 111.16 | 53.05 | 46.46 | 9.60 | 1981 | 25.26 | 48.00 | 31.79 | 16.67 | 0.98 |
|---|
 Return to R-Arctic Net Home Page