|
|
|||||||||||||||||
| Point ID: 5894 | Downloads | Plots | Site Data | Code: 1309 |
|
|
|||||||||||||||||
| Download | |
|---|---|
| Site Descriptor Information | Site Time Series Data |
| Link to all available data | |
|
|
| View: | Statistics | Time Series |
| Units: | mm |
| Statistic | Jan | Feb | Mar | Apr | May | Jun | Jul | Aug | Sep | Oct | Nov | Dec | Annual |
|---|---|---|---|---|---|---|---|---|---|---|---|---|---|
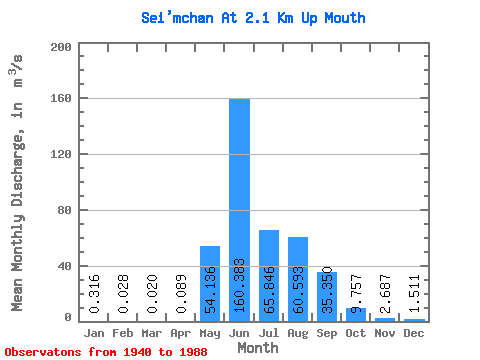
| Mean | 0.32 | 0.03 | 0.02 | 0.09 | 54.14 | 160.38 | 65.85 | 60.59 | 35.35 | 9.76 | 2.69 | 1.51 | 35.24 |
| Standard Deviation | 0.22 | 0.04 | 0.12 | 42.86 | 74.50 | 32.73 | 28.93 | 16.38 | 4.96 | 1.28 | 5.57 | ||
| Min | 0.01 | 0.00 | 0.02 | 0.00 | 1.11 | 64.30 | 23.40 | 23.60 | 10.10 | 1.46 | 0.01 | 0.04 | 35.24 |
| Max | 0.76 | 0.09 | 0.02 | 0.27 | 183.00 | 339.00 | 152.00 | 135.00 | 85.70 | 32.00 | 6.99 | 33.80 | 35.24 |
| Coefficient of Variation | 0.70 | 1.44 | 1.30 | 0.79 | 0.47 | 0.50 | 0.48 | 0.46 | 0.51 | 0.48 | 3.69 |
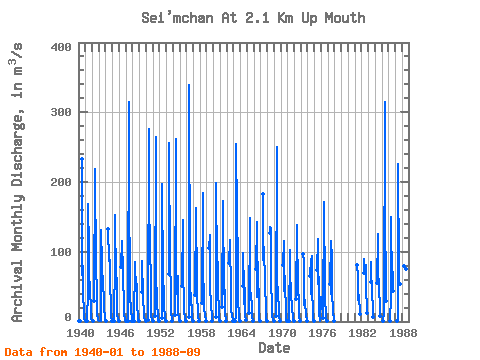
| Year | Jan | Feb | Mar | Apr | May | Jun | Jul | Aug | Sep | Oct | Nov | Dec | Annual | 1940 | 0.18 | 0.02 | 233.00 | 66.60 | 79.10 | 42.20 | 12.50 | 3.55 | 0.97 | 1941 | 0.18 | 0.26 | 45.20 | 169.00 | 103.00 | 66.10 | 46.30 | 15.90 | 4.16 | 1.41 | 1942 | 0.33 | 0.00 | 29.00 | 218.00 | 72.30 | 85.80 | 34.50 | 8.27 | 4.39 | 1.68 | 1943 | 0.53 | 0.09 | 0.02 | 0.00 | 131.00 | 84.40 | 60.60 | 54.80 | 64.70 | 20.30 | 4.15 | 2.26 | 35.24 | 1944 | 0.41 | 0.01 | 132.00 | 87.20 | 99.90 | 76.20 | 45.20 | 32.00 | 6.99 | 1.96 | 1945 | 0.35 | 0.05 | 90.00 | 153.00 | 57.20 | 69.80 | 55.80 | 10.40 | 3.75 | 1.72 | 1946 | 0.76 | 77.80 | 115.00 | 70.50 | 46.10 | 42.30 | 8.85 | 3.70 | 1.51 | 1947 | 0.34 | 0.01 | 1.11 | 315.00 | 108.00 | 119.00 | 37.70 | 15.60 | 3.99 | 0.38 | 1948 | 0.02 | 85.40 | 76.90 | 50.50 | 53.50 | 21.80 | 8.00 | 1.89 | 0.33 | 1949 | 42.60 | 87.40 | 36.10 | 27.80 | 17.30 | 5.59 | 1.49 | 0.05 | 1950 | 1.49 | 276.00 | 142.00 | 135.00 | 28.00 | 6.86 | 3.46 | 0.49 | 1951 | 0.01 | 8.25 | 264.00 | 60.20 | 36.10 | 22.50 | 10.90 | 2.76 | 0.44 | 1952 | 4.82 | 197.00 | 62.50 | 39.80 | 21.50 | 7.68 | 1.77 | 0.04 | 1953 | 67.70 | 256.00 | 77.20 | 89.40 | 38.10 | 11.90 | 3.95 | 0.91 | 1954 | 9.20 | 261.00 | 75.00 | 39.50 | 64.80 | 13.70 | 3.80 | 1.00 | 1955 | 0.07 | 51.30 | 146.00 | 59.40 | 36.40 | 15.40 | 4.89 | 1.72 | 0.17 | 1956 | 6.83 | 339.00 | 52.90 | 23.60 | 41.50 | 7.94 | 1.68 | 0.11 | 1957 | 38.10 | 163.00 | 49.90 | 35.30 | 15.30 | 6.08 | 1.90 | 0.16 | 1958 | 25.90 | 184.00 | 76.60 | 31.60 | 20.80 | 8.36 | 2.80 | 0.05 | 1959 | 106.00 | 124.00 | 42.30 | 30.80 | 23.70 | 6.76 | 1.23 | 1960 | 7.11 | 198.00 | 77.40 | 120.00 | 50.50 | 8.64 | 2.94 | 0.57 | 1961 | 21.10 | 173.00 | 39.00 | 54.40 | 36.40 | 10.30 | 2.84 | 0.07 | 1962 | 84.50 | 117.00 | 115.00 | 41.50 | 18.00 | 6.70 | 2.97 | 0.06 | 1963 | 0.01 | 6.17 | 255.00 | 152.00 | 88.60 | 29.10 | 10.80 | 2.19 | 0.38 | 1964 | 50.50 | 98.60 | 25.70 | 72.50 | 23.40 | 8.58 | 1.59 | 1965 | 11.90 | 149.00 | 46.30 | 34.50 | 25.00 | 6.36 | 1.44 | 0.16 | 1966 | 75.90 | 142.00 | 35.80 | 45.20 | 85.70 | 9.63 | 2.15 | 0.21 | 1967 | 183.00 | 88.30 | 107.00 | 53.10 | 59.60 | 12.50 | 2.59 | 0.35 | 1968 | 127.00 | 136.00 | 133.00 | 61.00 | 19.10 | 7.30 | 1.99 | 0.09 | 1969 | 7.89 | 250.00 | 68.00 | 31.50 | 26.90 | 6.66 | 1.48 | 0.25 | 1970 | 80.30 | 116.00 | 43.10 | 65.30 | 53.30 | 13.30 | 2.62 | 0.78 | 1971 | 0.01 | 102.00 | 76.50 | 34.50 | 42.30 | 18.00 | 6.41 | 1.69 | 0.28 | 1972 | 31.80 | 139.00 | 37.70 | 40.10 | 37.70 | 6.31 | 2.06 | 0.12 | 1973 | 96.20 | 87.20 | 23.40 | 30.60 | 29.50 | 8.00 | 3.11 | 0.66 | 1974 | 65.90 | 89.40 | 39.90 | 93.90 | 51.60 | 8.09 | 2.51 | 0.41 | 1975 | 73.50 | 94.90 | 53.60 | 118.00 | 10.10 | 1.46 | 0.01 | 33.80 | 1976 | 5.66 | 172.00 | 43.60 | 27.30 | 14.20 | 4.80 | 0.77 | 0.04 | 1977 | 53.50 | 115.00 | 39.80 | 103.00 | 43.70 | 12.60 | 4.02 | 0.51 | 1981 | 80.50 | 64.30 | 31.30 | 36.00 | 38.70 | 11.40 | 1982 | 70.20 | 89.80 | 67.90 | 81.70 | 53.80 | 12.70 | 1983 | 57.00 | 85.30 | 30.40 | 36.80 | 22.70 | 6.70 | 1984 | 55.90 | 126.00 | 79.90 | 42.80 | 25.30 | 8.09 | 1985 | 0.23 | 14.00 | 314.00 | 138.00 | 62.30 | 29.40 | 1986 | 0.27 | 36.30 | 150.00 | 41.90 | 99.80 | 43.10 | 1987 | 0.02 | 5.19 | 226.00 | 68.90 | 54.50 | 54.30 | 1988 | 79.40 | 76.40 | 33.10 | 74.90 | 27.60 |
|---|
 Return to R-Arctic Net Home Page