|
|
|||||||||||||||||
| Point ID: 459 | Downloads | Plots | Site Data | Code: 05DC002 |
|
|
|||||||||||||||||
| Download | |
|---|---|
| Site Descriptor Information | Site Time Series Data |
| Link to all available data | |
|
|
| View: | Statistics | Time Series |
| Units: | m3/s |
| Statistic | Jan | Feb | Mar | Apr | May | Jun | Jul | Aug | Sep | Oct | Nov | Dec | Annual |
|---|---|---|---|---|---|---|---|---|---|---|---|---|---|
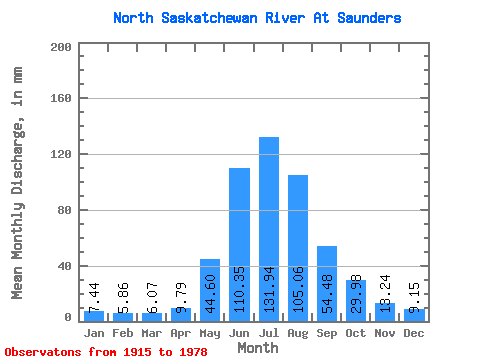
| Mean | 7.43 | 5.91 | 6.07 | 9.79 | 44.59 | 110.34 | 131.92 | 105.05 | 54.48 | 29.97 | 13.24 | 9.15 | 600.71 |
| Standard Deviation | 1.31 | 1.08 | 1.04 | 2.21 | 15.54 | 38.90 | 48.17 | 39.70 | 13.37 | 9.23 | 3.00 | 2.71 | 57.47 |
| Min | 6.07 | 4.21 | 4.58 | 7.08 | 26.47 | 41.29 | 36.07 | 25.85 | 27.93 | 18.11 | 7.49 | 6.59 | 497.25 |
| Max | 10.33 | 7.61 | 7.84 | 12.86 | 95.50 | 170.79 | 223.17 | 189.43 | 85.39 | 52.42 | 17.98 | 13.86 | 653.98 |
| Coefficient of Variation | 0.18 | 0.18 | 0.17 | 0.23 | 0.35 | 0.35 | 0.36 | 0.38 | 0.24 | 0.31 | 0.23 | 0.30 | 0.10 |
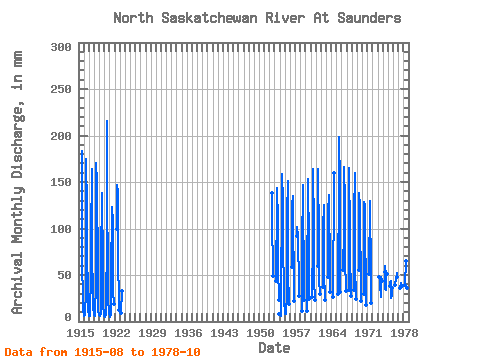
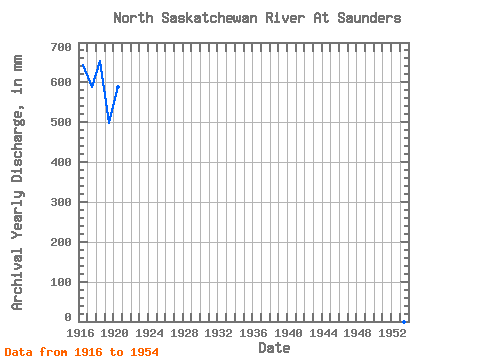
| Year | Jan | Feb | Mar | Apr | May | Jun | Jul | Aug | Sep | Oct | Nov | Dec | Annual | 1915 | 189.43 | 62.29 | 27.51 | 15.17 | 12.77 | 1916 | 6.64 | 6.10 | 6.75 | 11.25 | 30.46 | 156.73 | 180.09 | 123.00 | 74.34 | 30.98 | 12.81 | 6.75 | 643.23 | 1917 | 6.90 | 5.58 | 5.87 | 7.33 | 55.53 | 88.41 | 169.19 | 128.19 | 61.79 | 42.87 | 14.57 | 8.10 | 589.81 | 1918 | 6.90 | 6.48 | 6.59 | 12.86 | 38.41 | 170.79 | 154.66 | 129.23 | 77.36 | 33.42 | 12.01 | 7.53 | 653.98 | 1919 | 6.95 | 5.15 | 5.87 | 8.34 | 31.71 | 92.43 | 116.25 | 142.72 | 57.77 | 19.05 | 7.49 | 6.59 | 497.25 | 1920 | 7.63 | 5.30 | 4.91 | 7.99 | 33.48 | 72.33 | 223.17 | 141.69 | 53.75 | 22.21 | 13.21 | 8.77 | 589.08 | 1921 | 6.07 | 4.21 | 4.58 | 7.63 | 47.12 | 123.57 | 126.63 | 112.10 | 31.30 | 19.83 | 1922 | 99.96 | 151.55 | 142.20 | 61.28 | 27.04 | 12.66 | 1923 | 9.64 | 33.84 | 1952 | 142.72 | 117.81 | 48.88 | 1953 | 45.00 | 131.11 | 147.91 | 111.06 | 58.27 | 24.08 | 8.82 | 1954 | 8.04 | 6.86 | 6.18 | 7.08 | 43.34 | 116.04 | 164.00 | 133.90 | 85.39 | 31.55 | 17.98 | 13.86 | 630.89 | 1955 | 10.33 | 7.61 | 7.84 | 12.56 | 26.47 | 115.53 | 155.70 | 90.31 | 54.75 | 19.00 | 1956 | 60.20 | 125.08 | 139.61 | 106.91 | 46.77 | 22.89 | 1957 | 95.50 | 101.97 | 94.98 | 78.89 | 52.24 | 28.29 | 1958 | 11.20 | 81.48 | 147.18 | 152.06 | 124.04 | 54.75 | 24.13 | 1959 | 11.80 | 38.20 | 146.68 | 157.77 | 84.08 | 50.23 | 25.12 | 1960 | 27.61 | 86.90 | 169.19 | 104.32 | 45.31 | 23.36 | 1961 | 61.76 | 163.76 | 130.27 | 128.19 | 45.01 | 30.98 | 1962 | 37.84 | 98.96 | 129.23 | 108.47 | 54.75 | 24.03 | 1963 | 49.88 | 118.05 | 140.13 | 116.25 | 76.35 | 32.38 | 1964 | 27.14 | 148.19 | 165.04 | 1965 | 30.67 | 159.24 | 205.00 | 151.55 | 50.23 | 32.70 | 1966 | 57.09 | 97.95 | 171.79 | 131.31 | 67.31 | 33.48 | 1967 | 34.72 | 164.76 | 151.03 | 118.85 | 75.35 | 28.34 | 1968 | 35.50 | 116.04 | 164.52 | 106.91 | 60.78 | 25.48 | 1969 | 57.61 | 137.64 | 128.19 | 105.87 | 47.57 | 22.78 | 1970 | 30.83 | 128.59 | 128.71 | 100.17 | 37.67 | 18.11 | 1971 | 52.42 | 129.10 | 121.96 | 133.90 | 49.18 | 20.76 | 1973 | 49.46 | 45.06 | 40.38 | 27.51 | 48.22 | 44.79 | 1974 | 55.01 | 59.27 | 36.07 | 35.19 | 54.25 | 52.42 | 1975 | 39.96 | 41.29 | 45.41 | 25.85 | 27.93 | 37.00 | 1976 | 40.17 | 41.49 | 44.53 | 45.46 | 52.24 | 49.77 | 1977 | 37.63 | 41.64 | 40.22 | 37.89 | 38.88 | 39.70 | 1978 | 40.95 | 65.30 | 65.39 | 33.27 | 35.77 | 45.10 |
|---|
 Return to R-Arctic Net Home Page