|
|
|||||||||||||||||
| Point ID: 8667 | Downloads | Plots | Site Data | Code: 11513 |
|
|
|||||||||||||||||
| Download | |
|---|---|
| Site Descriptor Information | Site Time Series Data |
| Link to all available data | |
|
|
| View: | Statistics | Time Series |
| Units: | mm |
| Statistic | Jan | Feb | Mar | Apr | May | Jun | Jul | Aug | Sep | Oct | Nov | Dec | Annual |
|---|---|---|---|---|---|---|---|---|---|---|---|---|---|
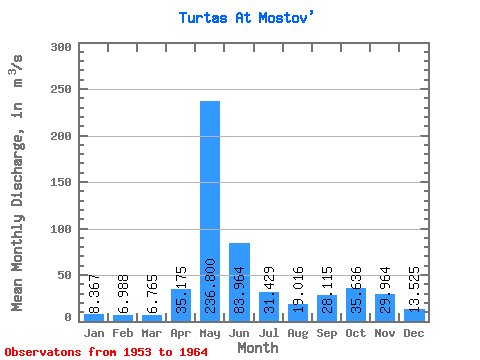
| Mean | 8.37 | 6.99 | 6.76 | 35.17 | 236.80 | 83.96 | 31.43 | 19.02 | 28.11 | 35.64 | 29.96 | 13.53 | 44.85 |
| Standard Deviation | 2.53 | 2.13 | 2.03 | 33.00 | 157.32 | 51.01 | 19.62 | 10.62 | 21.78 | 24.57 | 18.40 | 6.69 | 18.50 |
| Min | 4.65 | 4.07 | 4.31 | 6.09 | 67.40 | 27.50 | 8.42 | 8.26 | 8.68 | 8.96 | 10.20 | 6.09 | 21.10 |
| Max | 12.20 | 11.10 | 10.70 | 104.00 | 617.00 | 182.00 | 70.70 | 35.40 | 72.50 | 71.20 | 57.80 | 29.80 | 76.56 |
| Coefficient of Variation | 0.30 | 0.30 | 0.30 | 0.94 | 0.66 | 0.61 | 0.62 | 0.56 | 0.78 | 0.69 | 0.61 | 0.49 | 0.41 |
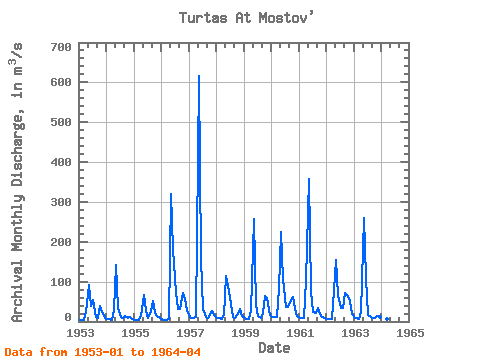
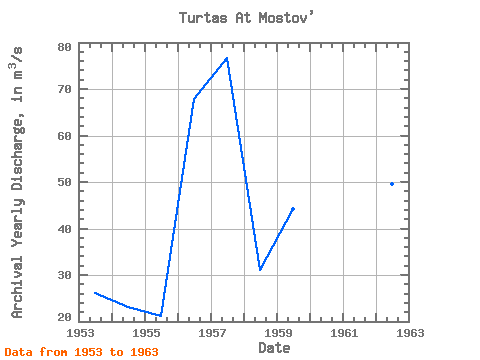
| Year | Jan | Feb | Mar | Apr | May | Jun | Jul | Aug | Sep | Oct | Nov | Dec | Annual | 1953 | 4.65 | 4.07 | 4.31 | 24.80 | 92.40 | 38.00 | 54.30 | 10.40 | 8.98 | 38.10 | 24.90 | 8.46 | 26.11 | 1954 | 7.00 | 5.18 | 4.94 | 27.80 | 142.00 | 33.90 | 10.10 | 8.26 | 13.10 | 9.94 | 10.20 | 6.09 | 23.21 | 1955 | 4.96 | 5.00 | 4.39 | 13.80 | 67.40 | 27.50 | 8.42 | 26.20 | 51.30 | 22.20 | 13.40 | 8.61 | 21.10 | 1956 | 5.40 | 4.09 | 4.99 | 6.09 | 320.00 | 182.00 | 70.70 | 31.30 | 31.30 | 71.20 | 57.70 | 29.80 | 67.88 | 1957 | 11.80 | 7.99 | 8.04 | 11.60 | 617.00 | 156.00 | 31.50 | 11.50 | 9.29 | 15.10 | 25.40 | 13.50 | 76.56 | 1958 | 9.64 | 8.10 | 7.43 | 17.40 | 114.00 | 88.60 | 45.00 | 11.10 | 8.71 | 18.00 | 30.80 | 14.00 | 31.07 | 1959 | 8.45 | 6.94 | 6.55 | 26.30 | 258.00 | 40.40 | 13.50 | 9.12 | 22.20 | 64.30 | 57.80 | 17.50 | 44.26 | 1960 | 12.20 | 11.10 | 10.70 | 80.60 | 224.00 | 106.00 | 36.20 | 35.40 | 49.60 | 60.70 | 32.10 | 13.50 | 56.01 | 1961 | 9.45 | 9.34 | 9.75 | 104.00 | 357.00 | 76.20 | 23.80 | 20.70 | 33.60 | 19.90 | 12.20 | 8.32 | 57.02 | 1962 | 7.35 | 7.45 | 6.87 | 78.60 | 154.00 | 66.00 | 35.00 | 33.10 | 72.50 | 63.60 | 52.50 | 18.50 | 49.62 | 1963 | 9.93 | 7.82 | 7.23 | 22.80 | 259.00 | 109.00 | 17.20 | 12.10 | 8.68 | 8.96 | 12.60 | 10.50 | 40.48 | 1964 | 9.57 | 6.77 | 5.98 | 8.31 |
|---|
 Return to R-Arctic Net Home Page