|
|
|||||||||||||||||
| Point ID: 6327 | Downloads | Plots | Site Data | Code: 3577 |
|
|
|||||||||||||||||
| Download | |
|---|---|
| Site Descriptor Information | Site Time Series Data |
| Link to all available data | |
|
|
| View: | Statistics | Time Series |
| Units: | mm |
| Statistic | Jan | Feb | Mar | Apr | May | Jun | Jul | Aug | Sep | Oct | Nov | Dec | Annual |
|---|---|---|---|---|---|---|---|---|---|---|---|---|---|
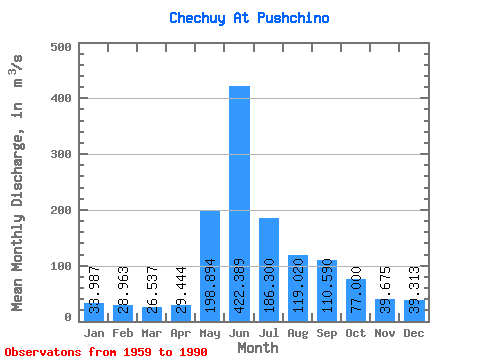
| Mean | 33.99 | 28.96 | 26.54 | 29.44 | 198.89 | 422.39 | 186.30 | 119.02 | 110.59 | 77.00 | 39.67 | 39.31 | 114.55 |
| Standard Deviation | 5.63 | 4.26 | 2.96 | 9.04 | 91.17 | 193.41 | 64.51 | 31.34 | 36.30 | 19.25 | 5.87 | 4.73 | 18.32 |
| Min | 26.90 | 23.30 | 21.90 | 20.40 | 1.83 | 0.28 | 108.00 | 61.90 | 54.60 | 45.50 | 30.90 | 32.00 | 83.89 |
| Max | 44.10 | 34.80 | 30.40 | 51.50 | 315.00 | 641.00 | 307.00 | 172.00 | 169.00 | 108.00 | 46.90 | 44.30 | 140.36 |
| Coefficient of Variation | 0.17 | 0.15 | 0.11 | 0.31 | 0.46 | 0.46 | 0.35 | 0.26 | 0.33 | 0.25 | 0.15 | 0.12 | 0.16 |
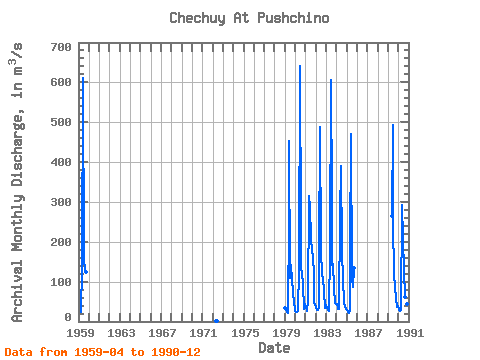
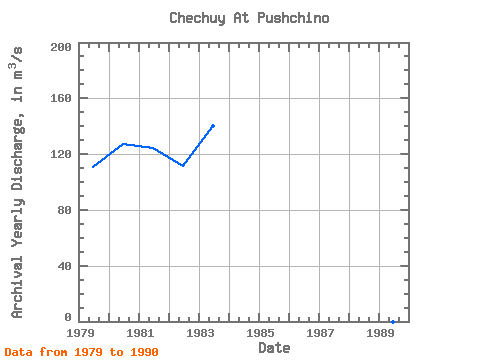
| Year | Jan | Feb | Mar | Apr | May | Jun | Jul | Aug | Sep | Oct | Nov | Dec | Annual | 1959 | 24.10 | 136.00 | 612.00 | 157.00 | 129.00 | 125.00 | 1972 | 1.83 | 0.28 | 1979 | 33.20 | 27.60 | 24.90 | 20.40 | 256.00 | 453.00 | 108.00 | 141.00 | 102.00 | 79.00 | 42.50 | 38.20 | 110.48 | 1980 | 26.90 | 23.60 | 23.80 | 26.60 | 134.00 | 641.00 | 232.00 | 129.00 | 123.00 | 92.80 | 30.90 | 44.30 | 127.33 | 1981 | 35.10 | 31.30 | 26.70 | 51.50 | 315.00 | 284.00 | 213.00 | 172.00 | 169.00 | 108.00 | 46.90 | 43.00 | 124.62 | 1982 | 35.80 | 29.70 | 28.20 | 33.10 | 165.00 | 488.00 | 183.00 | 114.00 | 108.00 | 75.30 | 35.00 | 41.70 | 111.40 | 1983 | 38.00 | 33.70 | 30.00 | 25.20 | 183.00 | 607.00 | 307.00 | 142.00 | 145.00 | 83.50 | 46.40 | 43.50 | 140.36 | 1984 | 44.10 | 34.80 | 30.40 | 30.50 | 266.00 | 390.00 | 181.00 | 95.90 | 59.40 | 45.50 | 35.20 | 32.00 | 103.73 | 1985 | 27.60 | 23.30 | 21.90 | 25.70 | 175.00 | 470.00 | 109.00 | 87.40 | 133.00 | 1989 | 264.00 | 492.00 | 246.00 | 118.00 | 86.90 | 59.00 | 37.40 | 38.80 | 1990 | 31.20 | 27.70 | 26.40 | 27.90 | 292.00 | 209.00 | 127.00 | 61.90 | 54.60 | 72.90 | 43.10 | 33.00 | 83.89 |
|---|
 Return to R-Arctic Net Home Page