|
|
|||||||||||||||||
| Point ID: 8576 | Downloads | Plots | Site Data | Code: 11145 |
|
|
|||||||||||||||||
| Download | |
|---|---|
| Site Descriptor Information | Site Time Series Data |
| Link to all available data | |
|
|
| View: | Statistics | Time Series |
| Units: | m3/s |
| Statistic | Jan | Feb | Mar | Apr | May | Jun | Jul | Aug | Sep | Oct | Nov | Dec | Annual |
|---|---|---|---|---|---|---|---|---|---|---|---|---|---|
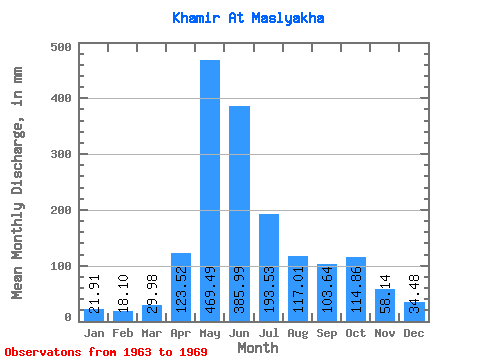
| Mean | 21.90 | 18.25 | 29.98 | 123.52 | 469.42 | 386.00 | 193.51 | 116.99 | 103.64 | 114.84 | 58.13 | 34.48 | 1673.22 |
| Standard Deviation | 6.03 | 3.51 | 8.84 | 44.57 | 123.52 | 229.47 | 75.72 | 23.55 | 54.76 | 60.06 | 14.15 | 12.69 | 355.51 |
| Min | 13.26 | 12.45 | 22.59 | 83.78 | 368.56 | 147.93 | 89.94 | 96.03 | 46.73 | 42.13 | 43.00 | 25.36 | 1325.49 |
| Max | 32.40 | 23.05 | 46.93 | 204.22 | 723.60 | 792.00 | 298.91 | 154.19 | 198.98 | 202.20 | 79.20 | 59.65 | 2261.14 |
| Coefficient of Variation | 0.28 | 0.19 | 0.29 | 0.36 | 0.26 | 0.59 | 0.39 | 0.20 | 0.53 | 0.52 | 0.24 | 0.37 | 0.21 |
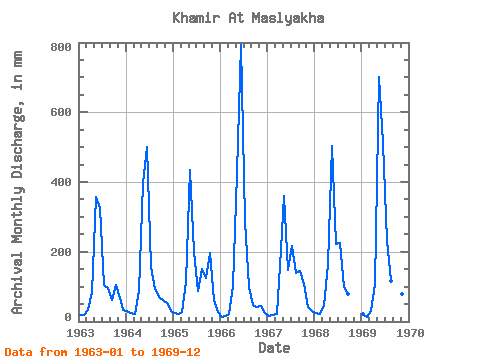
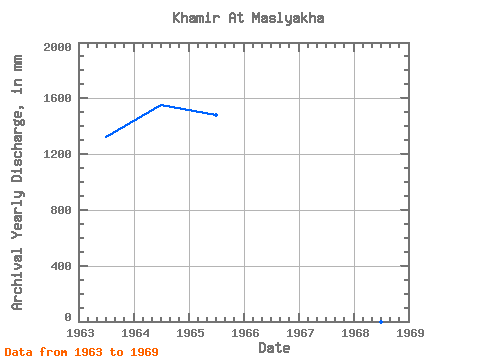
| Year | Jan | Feb | Mar | Apr | May | Jun | Jul | Aug | Sep | Oct | Nov | Dec | Annual | 1963 | 20.29 | 18.55 | 33.95 | 83.78 | 368.56 | 325.96 | 108.88 | 99.41 | 61.53 | 106.85 | 68.07 | 34.15 | 1325.49 | 1964 | 32.40 | 23.05 | 22.66 | 88.36 | 409.81 | 500.73 | 162.30 | 96.03 | 70.69 | 63.30 | 54.39 | 30.50 | 1551.85 | 1965 | 23.80 | 19.66 | 28.13 | 112.58 | 449.71 | 198.98 | 89.94 | 154.19 | 125.02 | 202.20 | 60.48 | 27.25 | 1483.29 | 1966 | 13.26 | 15.22 | 23.06 | 102.11 | 440.92 | 792.00 | 298.91 | 103.47 | 46.73 | 42.13 | 43.66 | 25.36 | 1945.47 | 1967 | 17.38 | 18.11 | 22.59 | 204.22 | 372.62 | 147.93 | 223.84 | 144.04 | 144.66 | 110.91 | 43.00 | 29.96 | 1472.07 | 1968 | 24.48 | 20.70 | 46.93 | 165.60 | 520.72 | 223.20 | 233.31 | 100.76 | 77.89 | 1969 | 21.71 | 12.45 | 32.53 | 108.00 | 723.60 | 513.16 | 237.37 | 121.05 | 198.98 | 163.66 | 79.20 | 59.65 | 2261.14 |
|---|
 Return to R-Arctic Net Home Page