|
|
|||||||||||||||||
| Point ID: 8463 | Downloads | Plots | Site Data | Code: 10237 |
|
|
|||||||||||||||||
| Download | |
|---|---|
| Site Descriptor Information | Site Time Series Data |
| Link to all available data | |
|
|
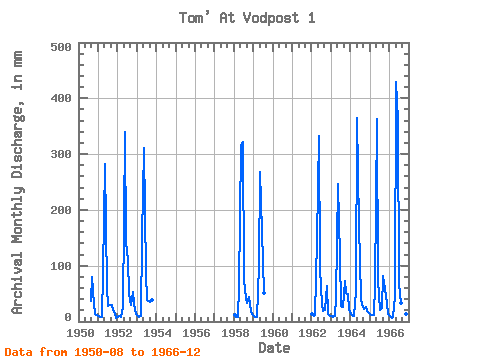
| View: | Statistics | Time Series |
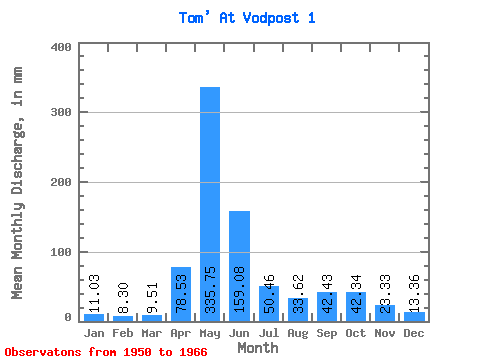
| Units: | m3/s |
| Statistic | Jan | Feb | Mar | Apr | May | Jun | Jul | Aug | Sep | Oct | Nov | Dec | Annual |
|---|---|---|---|---|---|---|---|---|---|---|---|---|---|
| Mean | 11.03 | 8.37 | 9.51 | 78.53 | 335.70 | 159.08 | 50.45 | 33.61 | 42.43 | 42.33 | 23.33 | 13.36 | 809.28 |
| Standard Deviation | 1.89 | 1.23 | 1.63 | 42.90 | 55.34 | 103.39 | 28.73 | 8.98 | 25.41 | 15.75 | 12.66 | 4.08 | 142.46 |
| Min | 7.99 | 6.51 | 7.63 | 26.31 | 254.28 | 59.56 | 20.96 | 20.15 | 19.24 | 22.05 | 13.09 | 7.11 | 595.26 |
| Max | 13.51 | 10.60 | 12.58 | 151.85 | 443.63 | 361.31 | 113.48 | 50.18 | 82.21 | 65.19 | 50.14 | 21.91 | 1042.41 |
| Coefficient of Variation | 0.17 | 0.15 | 0.17 | 0.55 | 0.17 | 0.65 | 0.57 | 0.27 | 0.60 | 0.37 | 0.54 | 0.30 | 0.18 |
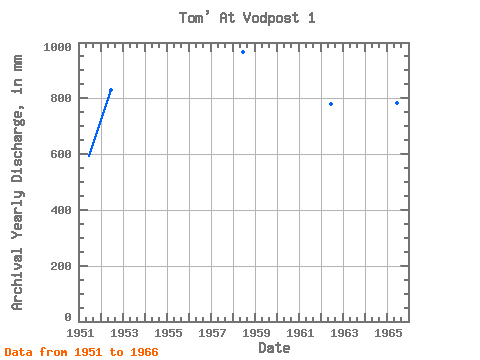
| Year | Jan | Feb | Mar | Apr | May | Jun | Jul | Aug | Sep | Oct | Nov | Dec | Annual | 1950 | 37.60 | 80.51 | 33.27 | 14.14 | 12.79 | 1951 | 9.41 | 7.12 | 7.63 | 89.15 | 292.14 | 59.56 | 28.00 | 31.11 | 30.11 | 22.18 | 15.45 | 7.11 | 595.26 | 1952 | 7.99 | 8.44 | 8.21 | 26.31 | 351.66 | 142.69 | 113.48 | 50.18 | 28.80 | 54.91 | 31.29 | 13.53 | 830.75 | 1953 | 10.39 | 8.00 | 9.67 | 151.85 | 320.55 | 85.48 | 40.30 | 37.33 | 35.48 | 40.71 | 1958 | 11.98 | 8.20 | 8.68 | 61.53 | 324.61 | 322.04 | 76.96 | 43.15 | 33.38 | 46.26 | 19.64 | 13.47 | 967.51 | 1959 | 10.31 | 7.86 | 8.24 | 99.10 | 275.92 | 162.33 | 52.07 | 1962 | 13.26 | 9.77 | 12.58 | 146.62 | 343.54 | 95.96 | 31.38 | 20.15 | 20.29 | 65.19 | 13.35 | 10.86 | 778.85 | 1963 | 10.16 | 7.85 | 10.51 | 42.68 | 254.28 | 114.94 | 28.40 | 27.19 | 72.00 | 52.34 | 50.14 | 21.91 | 689.84 | 1964 | 13.51 | 9.33 | 9.49 | 55.38 | 376.00 | 171.49 | 43.15 | 29.89 | 22.25 | 26.91 | 18.85 | 15.69 | 787.38 | 1965 | 13.35 | 10.60 | 11.67 | 66.24 | 374.65 | 75.01 | 20.96 | 24.34 | 82.21 | 59.51 | 34.04 | 14.34 | 782.23 | 1966 | 9.97 | 6.51 | 8.44 | 46.47 | 443.63 | 361.31 | 69.79 | 35.17 | 19.24 | 22.05 | 13.09 | 10.54 | 1042.41 |
|---|
 Return to R-Arctic Net Home Page