|
|
|||||||||||||||||
| Point ID: 8491 | Downloads | Plots | Site Data | Code: 10395 |
|
|
|||||||||||||||||
| Download | |
|---|---|
| Site Descriptor Information | Site Time Series Data |
| Link to all available data | |
|
|
| View: | Statistics | Time Series |
| Units: | mm |
| Statistic | Jan | Feb | Mar | Apr | May | Jun | Jul | Aug | Sep | Oct | Nov | Dec | Annual |
|---|---|---|---|---|---|---|---|---|---|---|---|---|---|
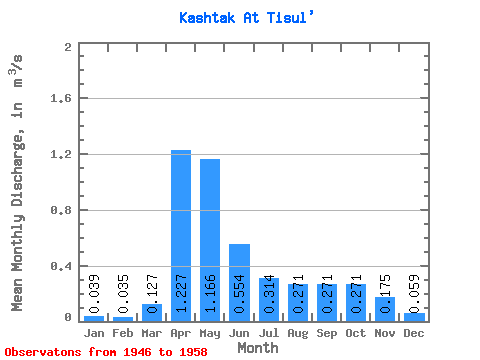
| Mean | 0.04 | 0.04 | 0.13 | 1.23 | 1.17 | 0.55 | 0.31 | 0.27 | 0.27 | 0.27 | 0.17 | 0.06 | 0.36 |
| Standard Deviation | 0.02 | 0.02 | 0.24 | 0.52 | 0.64 | 0.41 | 0.20 | 0.20 | 0.19 | 0.20 | 0.12 | 0.03 | 0.11 |
| Min | 0.01 | 0.01 | 0.00 | 0.44 | 0.41 | 0.15 | 0.14 | 0.08 | 0.07 | 0.01 | 0.02 | 0.02 | 0.23 |
| Max | 0.07 | 0.07 | 0.87 | 2.27 | 2.52 | 1.23 | 0.75 | 0.81 | 0.80 | 0.80 | 0.52 | 0.13 | 0.56 |
| Coefficient of Variation | 0.44 | 0.59 | 1.88 | 0.42 | 0.55 | 0.74 | 0.62 | 0.74 | 0.70 | 0.74 | 0.69 | 0.55 | 0.32 |
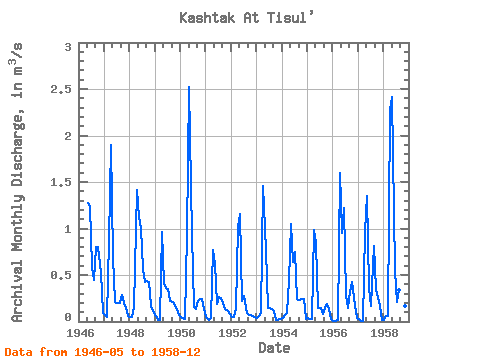
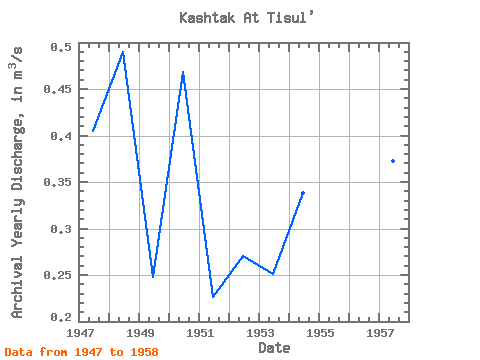
| Year | Jan | Feb | Mar | Apr | May | Jun | Jul | Aug | Sep | Oct | Nov | Dec | Annual | 1946 | 1.27 | 1.23 | 0.59 | 0.45 | 0.80 | 0.80 | 0.52 | 0.09 | 1947 | 0.07 | 0.04 | 0.87 | 1.90 | 0.69 | 0.21 | 0.20 | 0.20 | 0.28 | 0.20 | 0.14 | 0.06 | 0.41 | 1948 | 0.04 | 0.04 | 0.15 | 1.41 | 1.12 | 1.00 | 0.56 | 0.43 | 0.44 | 0.42 | 0.17 | 0.09 | 0.49 | 1949 | 0.06 | 0.02 | 0.02 | 0.96 | 0.41 | 0.36 | 0.35 | 0.22 | 0.21 | 0.17 | 0.13 | 0.07 | 0.25 | 1950 | 0.05 | 0.04 | 0.03 | 0.94 | 2.52 | 0.93 | 0.16 | 0.13 | 0.22 | 0.24 | 0.24 | 0.13 | 0.47 | 1951 | 0.05 | 0.01 | 0.04 | 0.77 | 0.62 | 0.19 | 0.26 | 0.25 | 0.20 | 0.13 | 0.11 | 0.08 | 0.23 | 1952 | 0.05 | 0.05 | 0.14 | 1.02 | 1.16 | 0.22 | 0.27 | 0.09 | 0.07 | 0.07 | 0.06 | 0.05 | 0.27 | 1953 | 0.04 | 0.06 | 0.09 | 1.46 | 0.77 | 0.15 | 0.15 | 0.13 | 0.11 | 0.01 | 0.02 | 0.03 | 0.25 | 1954 | 0.04 | 0.07 | 0.09 | 0.44 | 1.05 | 0.64 | 0.75 | 0.24 | 0.23 | 0.24 | 0.24 | 0.03 | 0.34 | 1955 | 0.04 | 0.02 | 0.02 | 0.98 | 0.84 | 0.15 | 0.14 | 0.08 | 0.14 | 0.19 | 0.13 | 0.03 | 0.23 | 1956 | 0.01 | 0.01 | 0.01 | 1.60 | 0.95 | 1.22 | 0.27 | 0.15 | 0.32 | 0.43 | 0.18 | 0.04 | 0.43 | 1957 | 0.02 | 0.01 | 0.00 | 0.97 | 1.35 | 0.36 | 0.17 | 0.81 | 0.35 | 0.25 | 0.17 | 0.02 | 0.37 | 1958 | 0.01 | 0.06 | 0.06 | 2.27 | 2.41 | 0.54 | 0.21 | 0.34 | 0.16 | 0.37 | 0.17 | 0.07 | 0.56 |
|---|
 Return to R-Arctic Net Home Page