|
|
|||||||||||||||||
| Point ID: 8463 | Downloads | Plots | Site Data | Code: 10237 |
|
|
|||||||||||||||||
| Download | |
|---|---|
| Site Descriptor Information | Site Time Series Data |
| Link to all available data | |
|
|
| View: | Statistics | Time Series |
| Units: | mm |
| Statistic | Jan | Feb | Mar | Apr | May | Jun | Jul | Aug | Sep | Oct | Nov | Dec | Annual |
|---|---|---|---|---|---|---|---|---|---|---|---|---|---|
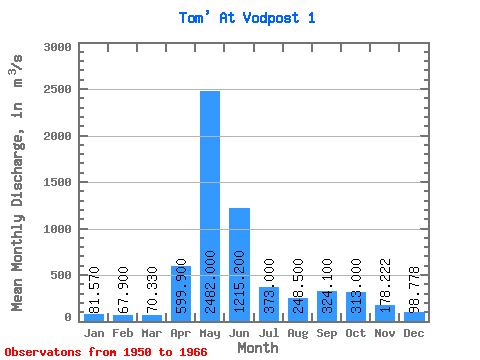
| Mean | 81.57 | 67.90 | 70.33 | 599.90 | 2482.00 | 1215.20 | 373.00 | 248.50 | 324.10 | 313.00 | 178.22 | 98.78 | 507.72 |
| Standard Deviation | 13.95 | 9.97 | 12.02 | 327.71 | 409.14 | 789.78 | 212.46 | 66.40 | 194.08 | 116.42 | 96.68 | 30.16 | 89.37 |
| Min | 59.10 | 52.80 | 56.40 | 201.00 | 1880.00 | 455.00 | 155.00 | 149.00 | 147.00 | 163.00 | 100.00 | 52.60 | 373.45 |
| Max | 99.90 | 86.00 | 93.00 | 1160.00 | 3280.00 | 2760.00 | 839.00 | 371.00 | 628.00 | 482.00 | 383.00 | 162.00 | 653.98 |
| Coefficient of Variation | 0.17 | 0.15 | 0.17 | 0.55 | 0.17 | 0.65 | 0.57 | 0.27 | 0.60 | 0.37 | 0.54 | 0.30 | 0.18 |
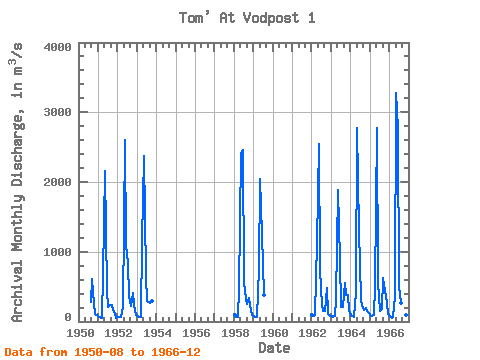
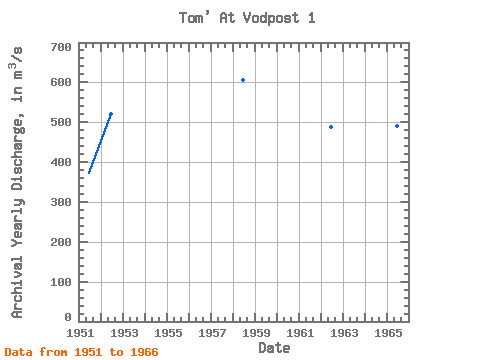
| Year | Jan | Feb | Mar | Apr | May | Jun | Jul | Aug | Sep | Oct | Nov | Dec | Annual | 1950 | 278.00 | 615.00 | 246.00 | 108.00 | 94.60 | 1951 | 69.60 | 57.80 | 56.40 | 681.00 | 2160.00 | 455.00 | 207.00 | 230.00 | 230.00 | 164.00 | 118.00 | 52.60 | 373.45 | 1952 | 59.10 | 68.50 | 60.70 | 201.00 | 2600.00 | 1090.00 | 839.00 | 371.00 | 220.00 | 406.00 | 239.00 | 100.00 | 521.19 | 1953 | 76.80 | 64.90 | 71.50 | 1160.00 | 2370.00 | 653.00 | 298.00 | 276.00 | 271.00 | 301.00 | 1958 | 88.60 | 66.50 | 64.20 | 470.00 | 2400.00 | 2460.00 | 569.00 | 319.00 | 255.00 | 342.00 | 150.00 | 99.60 | 606.99 | 1959 | 76.20 | 63.80 | 60.90 | 757.00 | 2040.00 | 1240.00 | 385.00 | 1962 | 98.00 | 79.30 | 93.00 | 1120.00 | 2540.00 | 733.00 | 232.00 | 149.00 | 155.00 | 482.00 | 102.00 | 80.30 | 488.63 | 1963 | 75.10 | 63.70 | 77.70 | 326.00 | 1880.00 | 878.00 | 210.00 | 201.00 | 550.00 | 387.00 | 383.00 | 162.00 | 432.79 | 1964 | 99.90 | 75.70 | 70.20 | 423.00 | 2780.00 | 1310.00 | 319.00 | 221.00 | 170.00 | 199.00 | 144.00 | 116.00 | 493.98 | 1965 | 98.70 | 86.00 | 86.30 | 506.00 | 2770.00 | 573.00 | 155.00 | 180.00 | 628.00 | 440.00 | 260.00 | 106.00 | 490.75 | 1966 | 73.70 | 52.80 | 62.40 | 355.00 | 3280.00 | 2760.00 | 516.00 | 260.00 | 147.00 | 163.00 | 100.00 | 77.90 | 653.98 |
|---|
 Return to R-Arctic Net Home Page