|
|
|||||||||||||||||
| Point ID: 7238 | Downloads | Plots | Site Data | Code: 12420 |
|
|
|||||||||||||||||
| Download | |
|---|---|
| Site Descriptor Information | Site Time Series Data |
| Link to all available data | |
|

|
| View: | Statistics | Time Series |
| Units: | mm |
| Statistic | Jan | Feb | Mar | Apr | May | Jun | Jul | Aug | Sep | Oct | Nov | Dec | Annual |
|---|---|---|---|---|---|---|---|---|---|---|---|---|---|
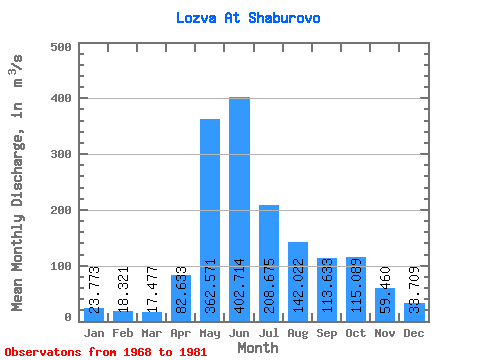
| Mean | 23.77 | 18.32 | 17.48 | 82.63 | 362.57 | 402.71 | 208.68 | 142.02 | 113.63 | 115.09 | 59.46 | 33.71 | 135.31 |
| Standard Deviation | 6.57 | 4.53 | 5.31 | 59.51 | 112.77 | 195.57 | 163.93 | 110.40 | 86.08 | 89.48 | 36.65 | 10.64 | 48.10 |
| Min | 11.00 | 9.13 | 9.25 | 25.80 | 228.00 | 107.00 | 75.50 | 66.80 | 43.10 | 39.60 | 25.70 | 21.90 | 87.28 |
| Max | 32.60 | 24.60 | 29.80 | 209.00 | 529.00 | 677.00 | 579.00 | 359.00 | 293.00 | 342.00 | 141.00 | 51.10 | 211.26 |
| Coefficient of Variation | 0.28 | 0.25 | 0.30 | 0.72 | 0.31 | 0.49 | 0.79 | 0.78 | 0.76 | 0.78 | 0.62 | 0.32 | 0.35 |
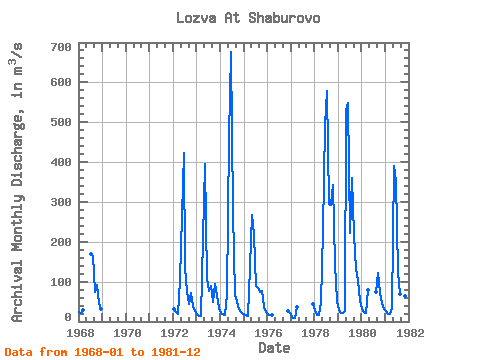
| Year | Jan | Feb | Mar | Apr | May | Jun | Jul | Aug | Sep | Oct | Nov | Dec | Annual | 1968 | 24.70 | 20.80 | 29.80 | 169.00 | 165.00 | 73.10 | 91.40 | 47.30 | 31.10 | 1972 | 32.60 | 24.60 | 17.80 | 105.00 | 267.00 | 423.00 | 137.00 | 75.10 | 43.10 | 70.60 | 38.50 | 26.80 | 105.09 | 1973 | 18.60 | 14.10 | 13.40 | 209.00 | 395.00 | 107.00 | 75.50 | 87.90 | 48.00 | 92.90 | 64.90 | 33.80 | 96.67 | 1974 | 22.30 | 18.30 | 16.50 | 69.20 | 464.00 | 677.00 | 275.00 | 66.80 | 51.40 | 39.60 | 25.70 | 22.40 | 145.68 | 1975 | 18.20 | 15.30 | 13.30 | 136.00 | 266.00 | 217.00 | 87.90 | 83.70 | 73.10 | 75.80 | 36.90 | 24.10 | 87.28 | 1976 | 19.50 | 17.20 | 15.40 | 26.90 | 21.90 | 1977 | 11.00 | 9.13 | 9.25 | 36.60 | 44.30 | 1978 | 28.90 | 16.90 | 16.70 | 48.50 | 228.00 | 494.00 | 579.00 | 296.00 | 293.00 | 342.00 | 141.00 | 51.10 | 211.26 | 1979 | 29.50 | 22.40 | 20.70 | 25.80 | 529.00 | 548.00 | 223.00 | 359.00 | 216.00 | 131.00 | 103.00 | 50.80 | 188.18 | 1980 | 30.80 | 23.60 | 20.80 | 79.00 | 75.00 | 122.00 | 70.50 | 45.60 | 30.30 | 1981 | 25.40 | 19.20 | 18.60 | 34.60 | 389.00 | 353.00 | 123.00 | 69.70 | 103.00 | 122.00 | 64.80 | 34.20 | 113.04 |
|---|
 Return to R-Arctic Net Home Page