|
|
|||||||||||||||||
| Point ID: 459 | Downloads | Plots | Site Data | Code: 05DC002 |
|
|
|||||||||||||||||
| Download | |
|---|---|
| Site Descriptor Information | Site Time Series Data |
| Link to all available data | |
|
|
| View: | Statistics | Time Series |
| Units: | mm |
| Statistic | Jan | Feb | Mar | Apr | May | Jun | Jul | Aug | Sep | Oct | Nov | Dec | Annual |
|---|---|---|---|---|---|---|---|---|---|---|---|---|---|
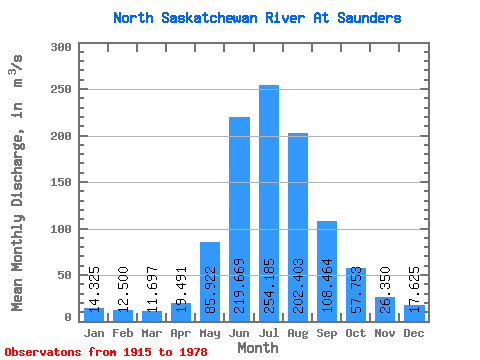
| Mean | 14.32 | 12.50 | 11.70 | 19.49 | 85.92 | 219.67 | 254.19 | 202.40 | 108.46 | 57.75 | 26.35 | 17.62 | 98.22 |
| Standard Deviation | 2.53 | 2.28 | 2.00 | 4.39 | 29.93 | 77.44 | 92.81 | 76.50 | 26.62 | 17.78 | 5.98 | 5.23 | 9.40 |
| Min | 11.70 | 8.90 | 8.82 | 14.10 | 51.00 | 82.20 | 69.50 | 49.80 | 55.60 | 34.90 | 14.90 | 12.70 | 81.30 |
| Max | 19.90 | 16.10 | 15.10 | 25.60 | 184.00 | 340.00 | 430.00 | 365.00 | 170.00 | 101.00 | 35.80 | 26.70 | 106.92 |
| Coefficient of Variation | 0.18 | 0.18 | 0.17 | 0.23 | 0.35 | 0.35 | 0.36 | 0.38 | 0.24 | 0.31 | 0.23 | 0.30 | 0.10 |
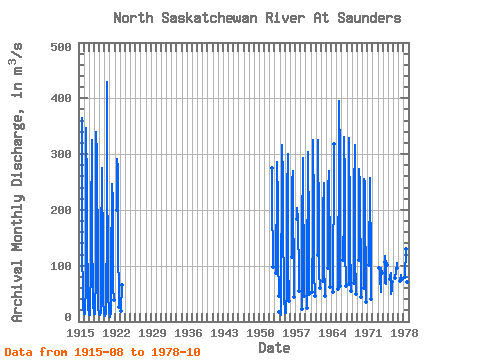
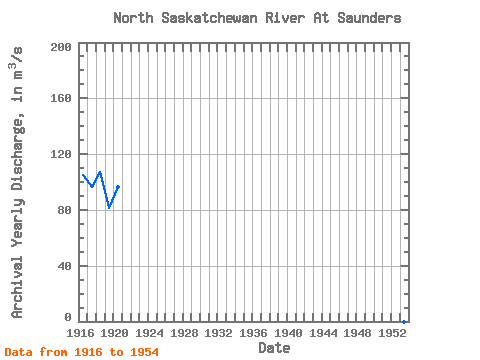
| Year | Jan | Feb | Mar | Apr | May | Jun | Jul | Aug | Sep | Oct | Nov | Dec | Annual | 1915 | 365.00 | 124.00 | 53.00 | 30.20 | 24.60 | 1916 | 12.80 | 12.90 | 13.00 | 22.40 | 58.70 | 312.00 | 347.00 | 237.00 | 148.00 | 59.70 | 25.50 | 13.00 | 105.17 | 1917 | 13.30 | 11.80 | 11.30 | 14.60 | 107.00 | 176.00 | 326.00 | 247.00 | 123.00 | 82.60 | 29.00 | 15.60 | 96.43 | 1918 | 13.30 | 13.70 | 12.70 | 25.60 | 74.00 | 340.00 | 298.00 | 249.00 | 154.00 | 64.40 | 23.90 | 14.50 | 106.92 | 1919 | 13.40 | 10.90 | 11.30 | 16.60 | 61.10 | 184.00 | 224.00 | 275.00 | 115.00 | 36.70 | 14.90 | 12.70 | 81.30 | 1920 | 14.70 | 11.20 | 9.46 | 15.90 | 64.50 | 144.00 | 430.00 | 273.00 | 107.00 | 42.80 | 26.30 | 16.90 | 96.31 | 1921 | 11.70 | 8.90 | 8.82 | 15.20 | 90.80 | 246.00 | 244.00 | 216.00 | 62.30 | 38.20 | 1922 | 199.00 | 292.00 | 274.00 | 122.00 | 52.10 | 25.20 | 1923 | 19.20 | 65.20 | 1952 | 275.00 | 227.00 | 97.30 | 1953 | 86.70 | 261.00 | 285.00 | 214.00 | 116.00 | 46.40 | 17.00 | 1954 | 15.50 | 14.50 | 11.90 | 14.10 | 83.50 | 231.00 | 316.00 | 258.00 | 170.00 | 60.80 | 35.80 | 26.70 | 103.15 | 1955 | 19.90 | 16.10 | 15.10 | 25.00 | 51.00 | 230.00 | 300.00 | 174.00 | 109.00 | 36.60 | 1956 | 116.00 | 249.00 | 269.00 | 206.00 | 93.10 | 44.10 | 1957 | 184.00 | 203.00 | 183.00 | 152.00 | 104.00 | 54.50 | 1958 | 22.30 | 157.00 | 293.00 | 293.00 | 239.00 | 109.00 | 46.50 | 1959 | 23.50 | 73.60 | 292.00 | 304.00 | 162.00 | 100.00 | 48.40 | 1960 | 53.20 | 173.00 | 326.00 | 201.00 | 90.20 | 45.00 | 1961 | 119.00 | 326.00 | 251.00 | 247.00 | 89.60 | 59.70 | 1962 | 72.90 | 197.00 | 249.00 | 209.00 | 109.00 | 46.30 | 1963 | 96.10 | 235.00 | 270.00 | 224.00 | 152.00 | 62.40 | 1964 | 52.30 | 295.00 | 318.00 | 1965 | 59.10 | 317.00 | 395.00 | 292.00 | 100.00 | 63.00 | 1966 | 110.00 | 195.00 | 331.00 | 253.00 | 134.00 | 64.50 | 1967 | 66.90 | 328.00 | 291.00 | 229.00 | 150.00 | 54.60 | 1968 | 68.40 | 231.00 | 317.00 | 206.00 | 121.00 | 49.10 | 1969 | 111.00 | 274.00 | 247.00 | 204.00 | 94.70 | 43.90 | 1970 | 59.40 | 256.00 | 248.00 | 193.00 | 75.00 | 34.90 | 1971 | 101.00 | 257.00 | 235.00 | 258.00 | 97.90 | 40.00 | 1973 | 95.30 | 89.70 | 77.80 | 53.00 | 96.00 | 86.30 | 1974 | 106.00 | 118.00 | 69.50 | 67.80 | 108.00 | 101.00 | 1975 | 77.00 | 82.20 | 87.50 | 49.80 | 55.60 | 71.30 | 1976 | 77.40 | 82.60 | 85.80 | 87.60 | 104.00 | 95.90 | 1977 | 72.50 | 82.90 | 77.50 | 73.00 | 77.40 | 76.50 | 1978 | 78.90 | 130.00 | 126.00 | 64.10 | 71.20 | 86.90 |
|---|
 Return to R-Arctic Net Home Page